
2012 THEMIS SCIENCE NUGGETS
Large-scale current systems and ground magnetic disturbance during deep substorm injections
by Jian Yang, Rice University
Introduction
The magnetic field reconfiguration in the magnetosphere and the magnetic disturbance on the ground during substorm expansions are usually explained by analyzing the formation and decay of large-scale current systems. Recent advances in numerical simulations have shown the advantage of providing a self-consistent global view of the coupled magnetosphere-ionosphere system. Using the equilibrium version of the Rice Convection Model (RCM-E) we have pursued the idea that substorm injections from the main plasma sheet to the inner magnetosphere consist of earthward-propagating bubbles, which contain lower entropy flux tubes than the background. In this study, we present a detailed analysis of the large-scale current systems and their effects on the ground magnetic field disturbance for an idealized substorm event simulated with the RCM-E. The objective of this study is to evaluate how well the bubble-injection picture can account for some classic features of the substorm expansion phase.
|
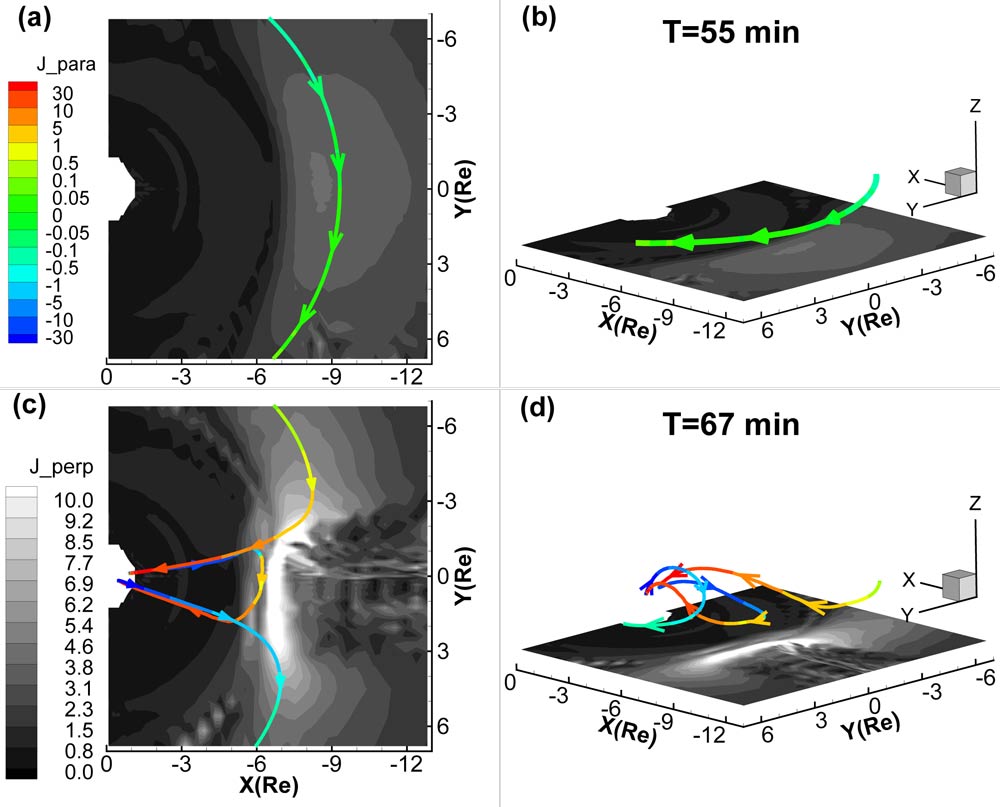
| Figure 1. Top view (left) and side view (right) of current density (in units of nA/m2) perpendicular to the magnetic field in the equatorial plane (gray contours) and the electric current line (colored) flowing through a fixed point at T=55 min and T=67 min. The red/yellow and blue/cyan colors represent FACs down to and up from the ionosphere. |
Results
The idealized event consists of the substorm growth phase, where energy is stored in the magnetosphere followed by an expansion phase where this energy is released into the region near the Earth. The growth phase simulation was for 55 minutes, in which the initial and boundary conditions are set according to empirical models driven by steady solar wind conditions. The expansion phase is modeled by placing a depleted plasma-sheet bubble along a sector centered at midnight.
Figure 1 compares representative electric current flowing through a fixed point (X=-7.56, Y=-5.58 and Z=1.24 RE) at T=55 minutes when the bubble is just about to be launched on the tailward boundary, with that at T=67 minutes when the bubble injection just reaches inside geosynchronous orbit. It clearly shows the simultaneous formation of the region-1-sence substorm current wedge (SCW) and the region-2-sence field-aligned currents (FACs).
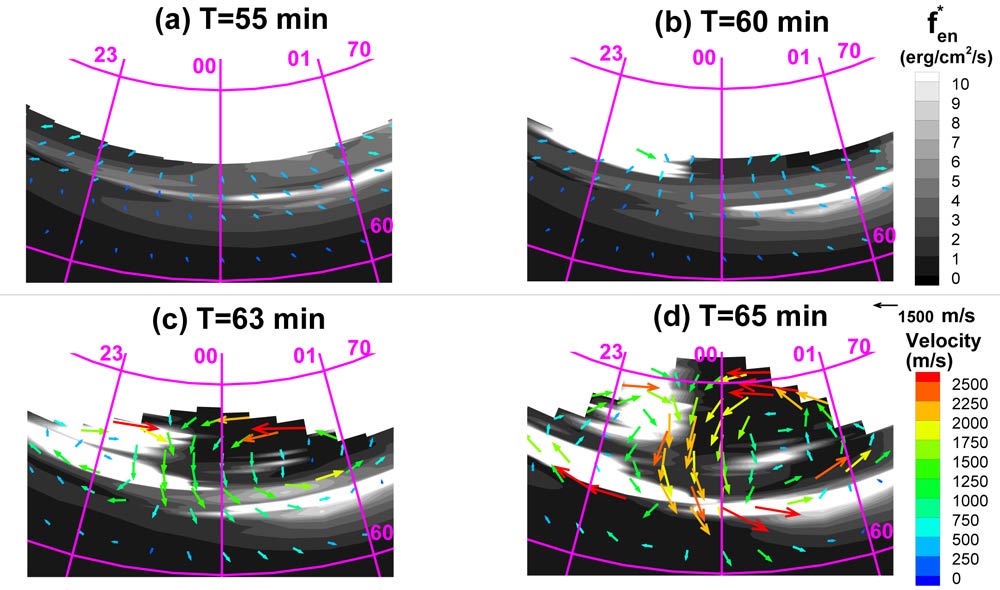
Figure 2a shows an east-west-aligned structure centered at ~64° latitude before substorm injection, which is presumably the diffuse aurora. The bright regions in Figures 2 b-d experience larger modified precipitation energy flux than 2a, primarily due to the enhanced FACs. Besides the east-west-aligned structure, an additional bulge-like structure appears at higher latitudes, corresponding to the large upward FAC density along the westward edge of the bubble. The bulge starts its rapid poleward expansion at about T=63 minutes, when the major dipolarization begins in the transition region at X≈-10 RE. Figure 2 also shows that the plasma flows exhibit vortices centered at the edges of the footprints of the bubble, where the SCW is mostly intensified.
Figure 3 shows the estimated ionospheric current systems during a real substorm injection event, which also exhibits both region-1-sense and region-2-sense FACs and a strong ionospheric current known as the westward electrojet. The RCM-E simulation results and observations are in good qualitative agreement, even though the simulation was not originally designed for that event.
|
| Figure 2. The modified precipitation energy flux (gray scales) and ionospheric E×B drift velocity (colored arrows). |
By comparing the electron phase space density (PSD) before and after the shock, we investigate the energy loss processes for both the high (95 keV) and low (15 keV) energy electrons (Figure 3). We find that when the electrons are scattered by the wideband (0.1-0.45 fce) chorus from the higher-density region to the lower-density region along the diffusion curves (black arrows in Figure 3), their kinetic energies can be transferred to the chorus; this energy loss is more efficient for the low energy (15 keV) electrons as they have larger density gradient and energy drop along the diffusion curves.

|
| Figure 3. (left) The estimated elementary current amplitudes. The size indicates the magnitude of the current. The red and blue symbols represent the direction of vertical currents. (right) The estimated equivalent ionospheric currents. The length of the black vectors indicates the magnitude of the current. The top and bottom plots show the current systems around and after the substorm onset. The onset occurred at MLAT 66.0 and MLT 21.7 in the field-of-view of FSMI station at ~06:39UT, April 09, 2008. |
The model of betatron acceleration is applied to reproduce the electron PSD after the shock (Figure 4). The good agreement between modeling results (solid lines in Figure 4) and observations (dashed lines in Figure 4) suggest that the betatron acceleration can be an effective mechanism for supplying the energy source. However, we cannot exclude the contributions from the drift-resonance as the ULF waves, well correlated with the fluxes of energetic electrons, are also observed. The suprathermal electrons injected from the magnetotail are absent, meaning that they are not the energy source in this event.
|
| Figure 4. Cartoon of deep-bubble-injection-associated dynamics in (a) the nightside ionosphere (Noon is at the top) and (b) the magnetosphere (The sun is to the left). |
Conclusion
Figure 4 summarizes a cartoon picture of the magnetosphere-ionosphere dynamics. The main conclusions are:
- Both the region-1-sense and region-2-sense FACs intensify substantially associated with deep bubble injections. The former resembles the SCW and flows along the eastern and western edges of the bubble. The latter is connected to the enhanced partial ring current in the magnetosphere associated with a dipolarization front earthward of the bubble. In the ionosphere, these two pairs of FACs are mostly interconnected via Pedersen currents.
- The horizontal ionospheric currents show a significant westward electrojet peaked at the equatorward edge of the footprint of the bubble.
- A prominent Harang-reversal-like boundary is seen in both ground ΔH disturbance and plasma flow pattern, appearing in the westward portion of the equatorward edge of the bubble footprint.
- The dramatic dipolarization inside the bubble causes the ionospheric map of the inner plasma sheet to exhibit a bulge-like structure, which may be related to auroral poleward expansion.
References
Biographical Note
Jian Yang is a research scientist in the Physics and Astronomy Department at Rice University. His current research interest includes numerical simulation and data analysis of plasma transport from the plasma sheet to the inner magnetosphere.
 Please send comments/suggestions to
Emmanuel Masongsong / emasongsong @ igpp.ucla.edu
Please send comments/suggestions to
Emmanuel Masongsong / emasongsong @ igpp.ucla.edu