2013 THEMIS SCIENCE NUGGETS
On the role of pressure perturbations around dipolarizing flux bundles
by Jiang Liu, UCLA EPSS & IGPP
Introduction
A dipolarizing flux bundle (DFB) is a small magnetotail flux tube with a significantly more dipolar magnetic field than its background. The leading edge of a DFB shows a sharp enhancement of the north-south component of the magnetic field, which is usually referred to as a "dipolarization front" (DF). A DFB typically propagates earthward at a high speed from the near-Earth reconnection region. The earthward motion of a DFB results in buildup of thermal pressure ahead of it. If the pressure buildup is in a specific distribution, it requires the DFB to possess field-aligned currents (FACs) in similar configuration to the substorm current wedge (SCW). Since the SCW is the major current system of the substorm process, the understanding of DFB-related FACs may help us solve the substorm mystery. However, a comprehensive observational view of the pressure distribution, and thus the FACs around the DFB was yet unavailable.
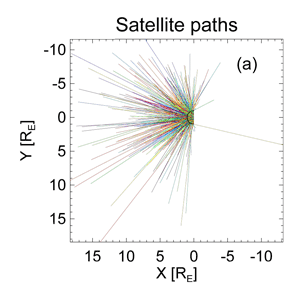
| Figure 1. Satellite paths in our statistical study. Each colored straight line is the satellite path’s equatorial projection of an individual event. The satellite path of each event is derived from the observed dipolarization front normal and convective velocity. The black semicircle in each panel denotes the outer boundary of the DFB. The coordinate system is a translated GSM system whose origin is at the DFB center. |
Results
We are now able to provide such a view by reconstructing the pressure map around a DFB with a statistical database of ~500 DFB events. First, based on data estimation, we assume the typical equatorial cross section of a DFB’s leading portion to be a 1-RE-radius semicircle. Second, for each event in our database, we reconstruct a satellite path relative to the semicircle from in situ observations. With all the events in the database, we get a map of satellite paths (Figure 1). In this map we convert temporal data of in situ measurement to spatial data collected on the reconstructed satellite paths.
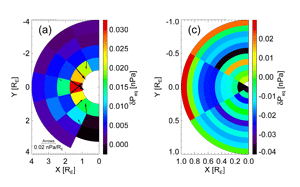
In the paths map we bin the area near the DFB and compute the median values of the pressure data collected on the satellite path segments that fall inside each bin to get a map of pressure distribution. Figure 2 shows such a map for the thermal pressure in the equatorial plane. The equatorial thermal pressure is strongest immediately ahead of the DFB’s leading point; it decreases with distance from that peak: toward the ambient plasma, toward the DFB interior, and toward the DFB flanks.
| Figure 2. Distribution of detrended (with pre-DFB quiet time value) equatorial thermal pressure, reconstructed from satellite paths in Figure 2. The color in each bin represents the median value of data points collected along all satellite path segments (each segment from an individual event) that fall into that bin. The left/right panel shows only the distribution outside/inside the DFB. The arrows in the left panel illustrate the gradients of the bin medians. |
Discussion
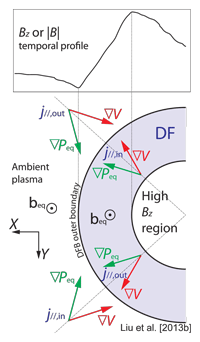
Figure 3 illustrates how the pressure distribution in Figure 2 requires FACs. The pressure gradient arrows in Figure 3 have been directly transferred from the distribution in Figure 2: They have a radial component toward the DFB’s outer boundary and an azimuthal component toward the meridian of the DFB’s leading point. According to theory, when combined with the flux tube volume gradients around the DFB (red arrows in Figure 3; they are estimated from magnetic field variations), they demand the FACs towards and away from Earth’s ionosphere at different locations as marked in Figure 3. The directions of the FACs are the same as the directions of SCW FACs; this suggests that the small DFBs are "wedgelets"- the building blocks of the substorm current wedge.
| Figure 3. Field-aligned currents associated with equatorial thermal pressure buildup near the DFB. The top black curve shows the typical in situ observation of a DFB. The lower part is an equatorial-cut cartoon of a DFB in which dipolarization front thickness (blue area) is exaggerated. Green arrows represent the gradients of equatorial thermal pressure; red arrows represent the gradients of unit magnetic flux-flux tube volume V. The magnetic field has a component out of the plane. The configurations of gradients are consistent with FACs toward (j∥,in) and out of (j∥,out) the ionosphere. |
As long as a DFB moves, it creates pressure and flux tube volume gradients that require the aforementioned FACs- the FACs are "supported" by the DFB motion. The wedgelet’s FACs thus travel earthward with the DFB and result in equatorward streaming auroral signatures in the ionosphere. When the DFBs finally arrive at the inner magnetosphere, the coalescence of several DFB-caused pressure buildups may lead to a substorm current wedge. The continual arrival of DFBs can result in a SCW of several tens of minutes.
Reference
Liu, J., V. Angelopoulos, X.-Z. Zhou, A. Runov, and Z. H. Yao (2013), On the role of pressure and flow perturbations around dipolarizing flux bundles, J. Geophys. Res., 118, 7104-7118, doi:10.1002/2013JA019256.Biographical Note
Jiang Liu is an assistant researcher within UCLA's Department of Earth, Planetary and Space Sciences. His research interests include substorms and transient energy carriers in the magnetosphere.
 Please send comments/suggestions to
Emmanuel Masongsong / emasongsong @ igpp.ucla.edu


