

2013 THEMIS SCIENCE NUGGETS
On the storm-time evolution of relativistic electron phase space density in Earth's outer radiation belt
by Drew L. Turner, UCLA IGPP
Introduction
Earth's outer radiation belt consists of a population of relativistic electrons stably trapped in the geomagnetic field. The outer belt is a particularly dynamic region, with electron fluxes measure in situ displaying drastic variations in intensity and location over a range of time scales, from minutes to decades. Outer belt variations tend to correspond with increased solar wind and magnetospheric dynamics, and variability can be especially extreme during geomagnetic storms. Reeves et al. [2003] studied the outer belt response to nearly 300 geomagnetic storms and found that 53% of the events resulted in an outer belt enhancement (as observed at geosynchronous orbit, GEO), 19% resulted in an outer belt depletion, and 28% resulted in no significant change in the outer belt flux of relativistic electrons. Reeves et al. [2003] discussed how the variability is ultimately the result of competing source, loss, and transport processes active at different levels during different events. Here, we studied the outer belt response to 53 geomagnetic storms (Dstmin < -40 nT) that occurred during the THEMIS era (Dec. 2007 - Aug. 2012), but we have improved on previous studies by examining the evolution of outer belt electron phase space density (PSD) for fixed values of the three adiabatic invariants (μ, K, and L*). Furthermore, we have examined two events in detail: one that resulted in an overall enhancement of the outer belt and the second that resulted in a depletion of the outer belt. Using in situ and ground-based data from various spacecraft and ground observatories, we also examined whistler-mode chorus and hiss, ultralow frequency (ULF), and electromagnetic ion cyclotron (EMIC) wave activity, each of which has been identified as important to various source, loss, and transport processes for outer belt electrons.
Results
We quantified the effect of the storms based on the change in the peak level of PSD throughout the outer belt during the event. We limited our study to μ = 1000 MeV/G and K < 0.025 G1/2RE, corresponding to near-equatorially mirroring relativistic (energies > ~700 keV) electrons throughout the outer belt. If the peak level in PSD increased (decreased) by more than a factor of 2 after a storm compared to the pre-storm average, then the storm was recorded as an enhancement (depletion) event. Those storms in which the PSD level remained about the same after the storm compared to before were categorized as events displaying no significant change. From the 53 storms examined, we found that 58% were outer belt enhancement events, 17% were depletion events, and 25% resulted in no significant change. These results are notably similar to those from the Reeves et al. [2003] study, yet they are from an entirely independent event database and in situ dataset.
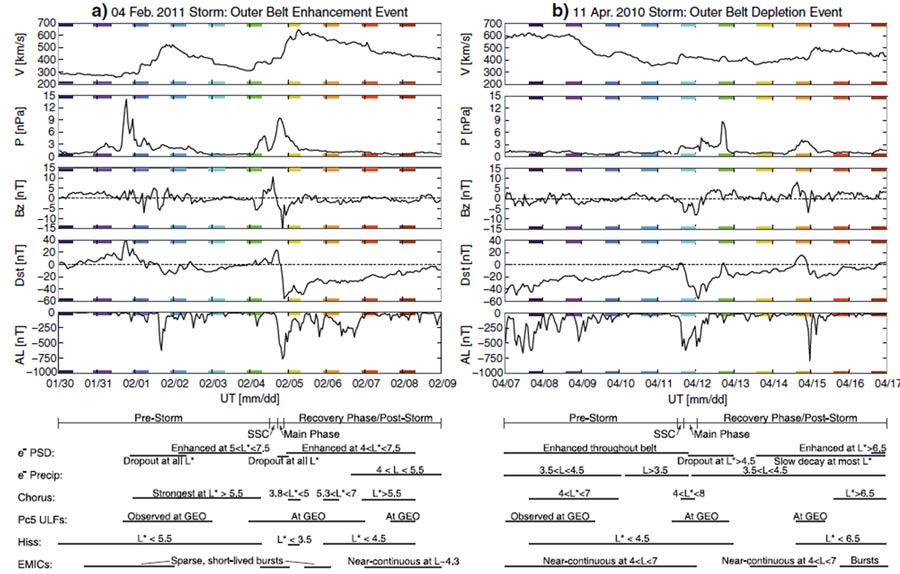
To investigate why different storms result in such different outer radiation belt responses, we examined two events in detail. The first was a storm that occurred on 04 February 2011, which resulted in a strong enhancement of the outer radiation belt. The second was a storm that occurred on 11 April 2010 and resulted in an overall depletion of the outer belt electrons. The solar wind and geomagnetic indices from these two storms are shown in Figure 1, along with a timeline summary of various activity observed throughout the system. The 04 Feb. 2011 storm resulted from a high-speed solar wind stream (HSS), which was the second of two HSSs to hit the Earth in less than 6 days. Conversely, the 11 Apr. 2010 storm resulted from a glancing impact from an interplanetary coronal mass ejection (ICME). Both storms had similar minimum Dst levels around -60 nT.
|
| Figure 1. Solar wind and geomagnetic indices during both events. (a) Solar wind speed (V), dynamic pressure (P), and the GSM Z-component of the IMF vector (Bz), with the Dst and AL indices for the 10 day period from 30 January– 08 February 2011. The colored bars on the X-axis correspond to the time periods in which the THEMIS spacecraft were in the outer radiation belt, corresponding to the same colors in the distributions shown in Figure 2 (a and b). (b) The same quantities shown in (a) but for the 10 day period from 07 to 16 April 2010. The colored bars again represent periods when THEMIS was in the outer belt and correspond to the same colors in the distributions shown in Figure 2 (c and d) and the wave data shown in Figure 3. Below these plots, timelines corresponding to the periods shown on the X-axes identify key features for each storm, including (i) the storm phases, (ii) electron phase space density dynamics (e-PSD), (iii) electron precipitation into the atmosphere (e-Precip.), (iv) chorus wave activity, (v) Pc5 ULF wave activity, (vi) hiss wave activity, and (vii) EMIC wave activity. |
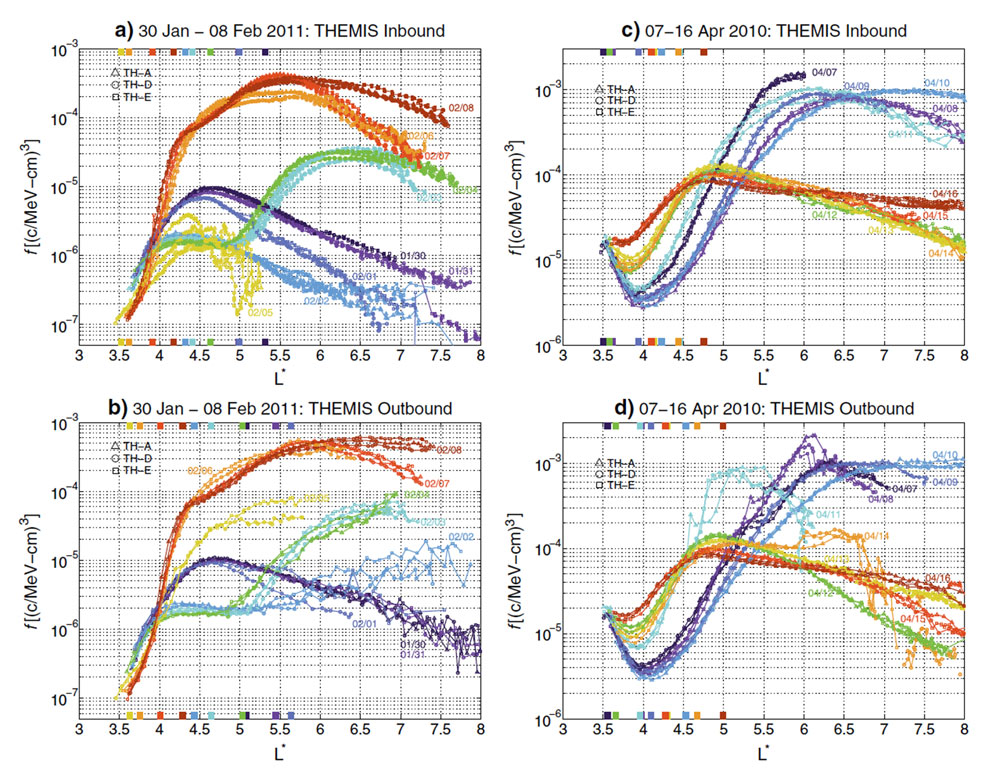
The time evolution of the outer belt PSD during the course of these two storms is shown in Figure 2. During the 10-day period around the 04 Feb. 2011 event, there were two dropouts (i.e., sudden, catastrophic losses) of the outer belt electrons, both of which followed after the impacts of the high-pressure stream interaction regions that preceded the two HSSs. After the first HSS hit on 31 Jan., the dropout was observed from 01-02 Feb, resulting in the distribution shown in Fig 2a for 02 Feb. Subsequently, some source mechanism was active at higher L*, resulting in a double outer belt structure. This double outer belt was eradicated by the dropout associated with the main phase of the storm on 04 Feb. Then, during the recovery phase, the outer belt became significantly enhanced above pre-event levels and a growing peak in PSD was observed.
The behavior of the outer belt during the 11 Apr. 2010 event was notably different. The belt was at high levels and relatively stable during the several days leading up to the impact of the ICME. After the ICME impacted the magnetosphere, a dropout occurred, reducing the peak level by around an order of magnitude. The outer belt remained at these low levels and revealed some slow decay at lower L* and slow enhancements at higher L*, likely due to outward radial transport.
|
| Figure 2. Phase space density L* distributions for μ= 1000 MeV/G and K< 0.025 G1/2 RE during the 10 day periods surrounding two geomagnetic storms. For the February 2011 storm, distributions from (a) inbound portions of the THEMIS orbits and (b) outbound trajectories are shown with symbols corresponding to the three THEMIS spacecraft (triangles: TH-A; circles: TH-D; squares: TH-E) and colors (also labeled with date in month/day format) corresponding to the times shown in Figure 2a. The plasmapause locations, calculated using the O'Brien and Moldwin [2003] model using Dst, are indicated for each day with the corresponding colored bars on the X-axis. Note that the inbound trajectories occurred before the outbound trajectories of the same color. (c and d) show the distributions from the April 2010 storm in the same format but with colors corresponding to those shown in Figure 1. |
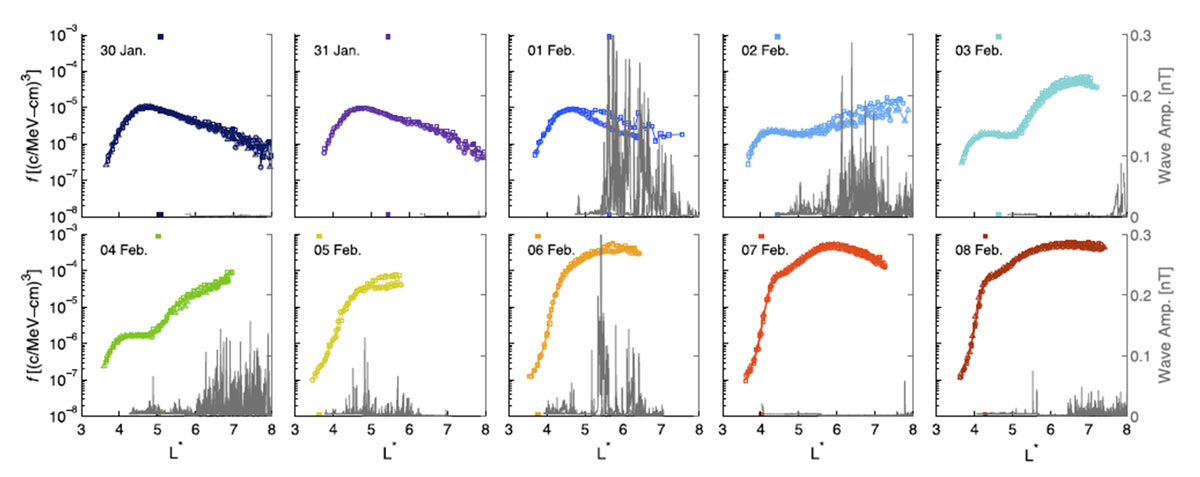
Concerning wave activity during these two storms, we examined whistler-mode chorus and hiss data from THEMIS, EMIC waves from the GOES spacecraft and CARISMA network of ground magnetometers, and ULF wave power from THEMIS and GOES. Figure 3 shows that for the 04 Feb. 2011 event, chorus waves were strongest during the times and L* ranges of the PSD enhancements observed after both HSS impacts. This, especially combined with the growing peaks in PSD observed, is strong evidence of local acceleration of relativistic electrons by wave-particle interactions between chorus waves and a seed population of lower energy electrons. Interestingly, there were very few chorus waves observed during the recovery phase of the 11 Apr. 2010 event.
|
| Figure 3. Electron PSD and chorus wave amplitude distributions in L* observed by TH-A, TH-D, and TH-E during the February 2011 storm. Only observations from the outbound trajectories of the orbit are shown, since these correspond to the 01:00-05:00 MLT sector. The different plots show the PSD distribution (corresponding to the left vertical axis) and chorus wave amplitudes (corresponding to the right vertical axis) for each day in the period of interest, as labeled, and for the PSD curves, the colors correspond to those used in Figures 2 and 3. The plasmapause locations, calculated using the O’ Brien and Moldwin [2003] model using Dst, are indicated for each day with the corresponding colored bars on the X-axis. |
Figure 4 shows the time and L-shell of EMIC waves observed during both events. During the Feb. 2011 event, EMIC waves were sparse. The strongest activity occurred at lower L-shells (L~4 to 4.5) during the late recovery phase of the storm, which is consistent with the precipitating electrons observed by POES spacecraft at low-Earth orbit (not shown here; see paper Fig. 4) and may be responsible for the bite out of the PSD distribution observed on 07-08 Feb. 2011. Conversely, the Apr. 2010 storm included much stronger and widespread EMIC wave activity. This is also consistent with enhanced precipitation observed by the POES spacecraft. Interestingly however, EMIC wave activity was not observed at heightened levels during the main phase of both storms.
Finally, plasmaspheric hiss (not shown here) was stronger and covered a broader range of L-shells during the Apr. 2010 storm, and enhanced ULF wave activity in the Pc5 band (not shown here) was more consistently prolonged during the Feb. 2011 storm.

|
| Figure 4. Locations in L and durations of EMIC waves observed by CARISMA, Sodankyla, and Halley Bay ground magnetometers and GOES spacecraft at GEO for (a) the February 2011 storm and (b) the April 2010 storm. |
Conclusion
Based on comparing and contrasting the effects of two storms on Earth’s outer radiation belt, we reached the following conclusions:
- Compared to the outer belt depleting storm (i.e., Apr. 2010), the outer belt enhancing storm (Feb. 2011) exhibited more enhanced chorus activity over a broader range in L*, less hiss activity during the recovery phase, fewer and sparsely located EMIC wave activity, and more prolonged ULF wave activity in the Pc5 frequency band.
- We observed evidence of local acceleration of relativistic electrons in the form of growing peaks in PSD for fixed μ and K. Interestingly, these peaks were collocated in L* with the strongest chorus wave amplitudes and ceased growing when the chorus activity stopped. This is strong evidence of local acceleration by wave-particle interactions with whistler-mode chorus waves.
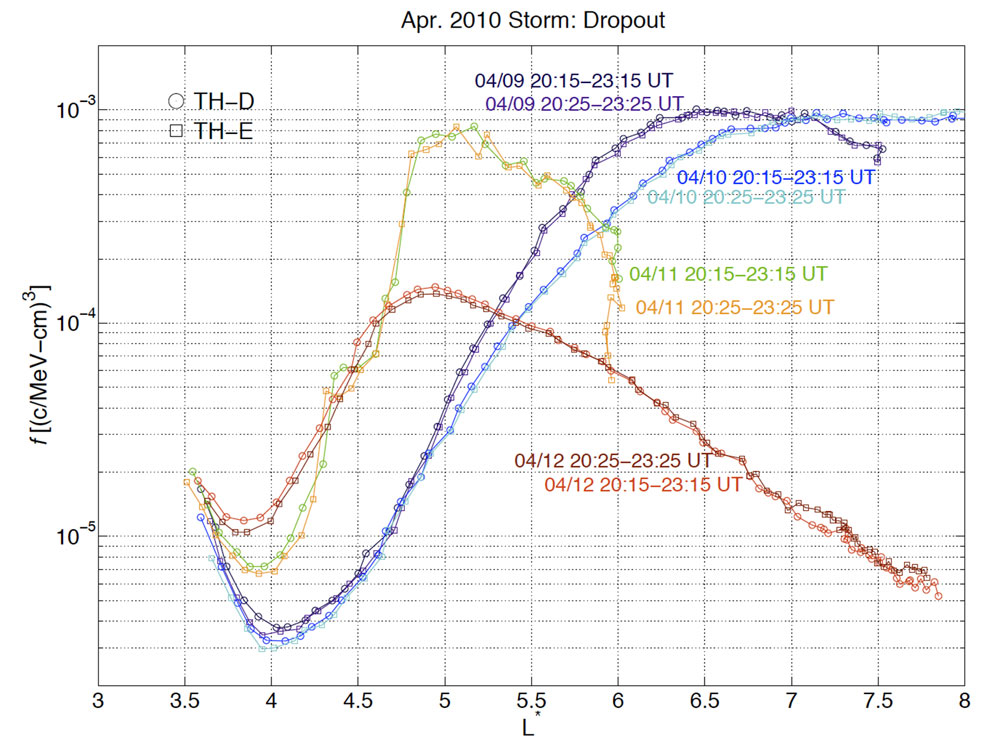
- Dropouts of PSD throughout most of the pre-event outer belt followed after sudden enhancements of solar wind dynamic pressure. Furthermore, the evolution of the PSD profiles (e.g., Fig. 5) revealed telltale signatures of losses due to magnetopause shadowing and subsequent outward radial transport [e.g., Turner et al., 2012 and references therein] such as loss starting at higher L* and moving in and a sharp cutoff on the PSD radial distribution.
- We showed how a new outer belt can evolve out of a remnant belt leftover after a dropout. This can result in a double outer belt structure, similar to that observed by Baker et al. [2013]. This scenario was observed for the Feb. 2011 storm and is summarized in Figure 6. Of the 53 storms examined for this study, such a double outer belt structure was observed in 13 events, always following after an initial dropout.
- 58% of the storms examined resulted in an enhancement of PSD in the outer belt; 17% resulted in a depletion of PSD; and 25% resulted in no significant change.
|
| Figure 5. PSD evolution during the dropout from the April 2010 storm. Note that the colors here correspond to the times listed, not to those from the previous figures. This evolution reveals telltale signatures of magnetopause shadowing and subsequent enhanced outward radial transport. |

|
| Figure 6. The formation of a double outer belt structure from the remnant belt leftover after a dropout. Note that the colors correspond to the times listed, not to those from the previous figures. The dropout started on 01 Feb. after the high-pressure phase of a stream interaction region and revealed signatures telltale of magnetopause shadowing and subsequent outward radial transport (note the cutoff in the distribution at L* ~ 6.5 in the 02/01 04:30 curve and how the loss was strongest at higher L* and moved to lower L* over time). The cyan curve is the remnant belt leftover after this dropout. The new, second outer belt evolved out of this remnant belt distribution, resulting in a two peaked structure. Interestingly, the new belt formed as a growing peak in PSD at around L* ~ 6, which corresponded to the peak in chorus wave activity. The double belt structure observed here was even more distinct when observed in electron fluxes. |
Reference
Baker, D. N. et al., A long lived relativistic electron storage ring embedded within the Earth’ s outer Van Allen radiation zone, Science, 340, 186, doi:10.1126/science.1233518.O’Brien, T. P. and M. B. Moldwin (2003), Empirical plasmapause models from magnetic indices, Geophys. Res. Lett., 30(4), 1152, doi:10.1029/2002GL016007.
Reeves, G. D., K. L. McAdams, R. H. W. Friedel, and T. P. O’Brien (2003), Acceleration and loss of relativistic electrons during geomagnetic storms, Geophys. Res. Lett., 30(10), 1529, doi:10.1029/2002GL016513.
Turner, D. L., Y. Y. Shprits, M. Hartinger, and V. Angelopoulos (2012), Explaining sudden losses of relativistic electrons during geomagnetic storms, Nature Phys., 8, doi:10.1038/NPHYS2185.
Turner, D. L., V. Angelopoulos, W. Li, M. D. Hartinger, M. Usanova, I. R. Mann, J. Bortnik, and Y. Shprits (2013), On the storm-time evolution of relativistic electron phase space density in Earth's outer radiation belt, J. Geophys. Res. Space Physics, 118, 2196–2212, doi:10.1002/jgra.50151.
Biographical Note
Drew L. Turner is an assistant researcher within UCLA's Department of Earth, Planetary and Space Sciences. His research interests include energetic particles in space plasmas and space science instrumentation.
 Please send comments/suggestions to
Emmanuel Masongsong / emasongsong @ igpp.ucla.edu
Please send comments/suggestions to
Emmanuel Masongsong / emasongsong @ igpp.ucla.edu