

2018 THEMIS SCIENCE NUGGETS
First statistical study of STEVE, a mysterious subauroral optical phenomenon
by Bea Gallardo-Lacourt
University of Calgary
Introduction
Exciting new research reveals the discovery of a new optical upper-atmosphere phenomenon, located several degrees equatorward from the auroral oval. Although amateur auroral photographers documented this emission for decades, it is a new phenomenon for the scientific community. Based on photographers’ observations, the new optical structure appears as a narrow, luminous mauve structure located across the night sky in the east-west direction over thousands of kilometers. Initially, the phenomenon was incorrectly named ‘proton arc’ due to the equatorward location of the emission. Later, a denomination without physical implications was given to the phenomenon, later referred to as “Steve.”
The first report in scientific literature identified “Steve” in the scientific optical dataset using data from an amateur auroral photographer. The report describes observations of REdline Geospace Observatory (REGO) data, in which “Steve” was found to be located equatorward of the aurora oval - in the suburoral region. More specifically, the structure extended thousands of kilometers in longitude, but its width was only tens of kilometers in latitude. In addition, Swarm-A crossed the optical structure, revealing that the observed luminosity was associated with a hot stream (~6000° K) of fast moving plasma (>6 km/sec) less than 50 km in north-south extent. Interestingly, the measured magnetic field perturbation led to a small downward field-aligned current (FAC). This result suggested that “Steve” may not be generated like auroral arcs, which are associated with upward FACs [Kamide and Akasofu, 1976]. Based on these observations, scientists converted the “Steve” name into the backronym: Strong Thermal Emission Velocity Enhancement (STEVE).
The unprecedented coverage provided by white light THEMIS all-sky imagers (ASI) and the Redline Emission Geospace Observatory (REGO) dataset enable scientists to discover details of when STEVE is formed and the optical features of its structure.
|
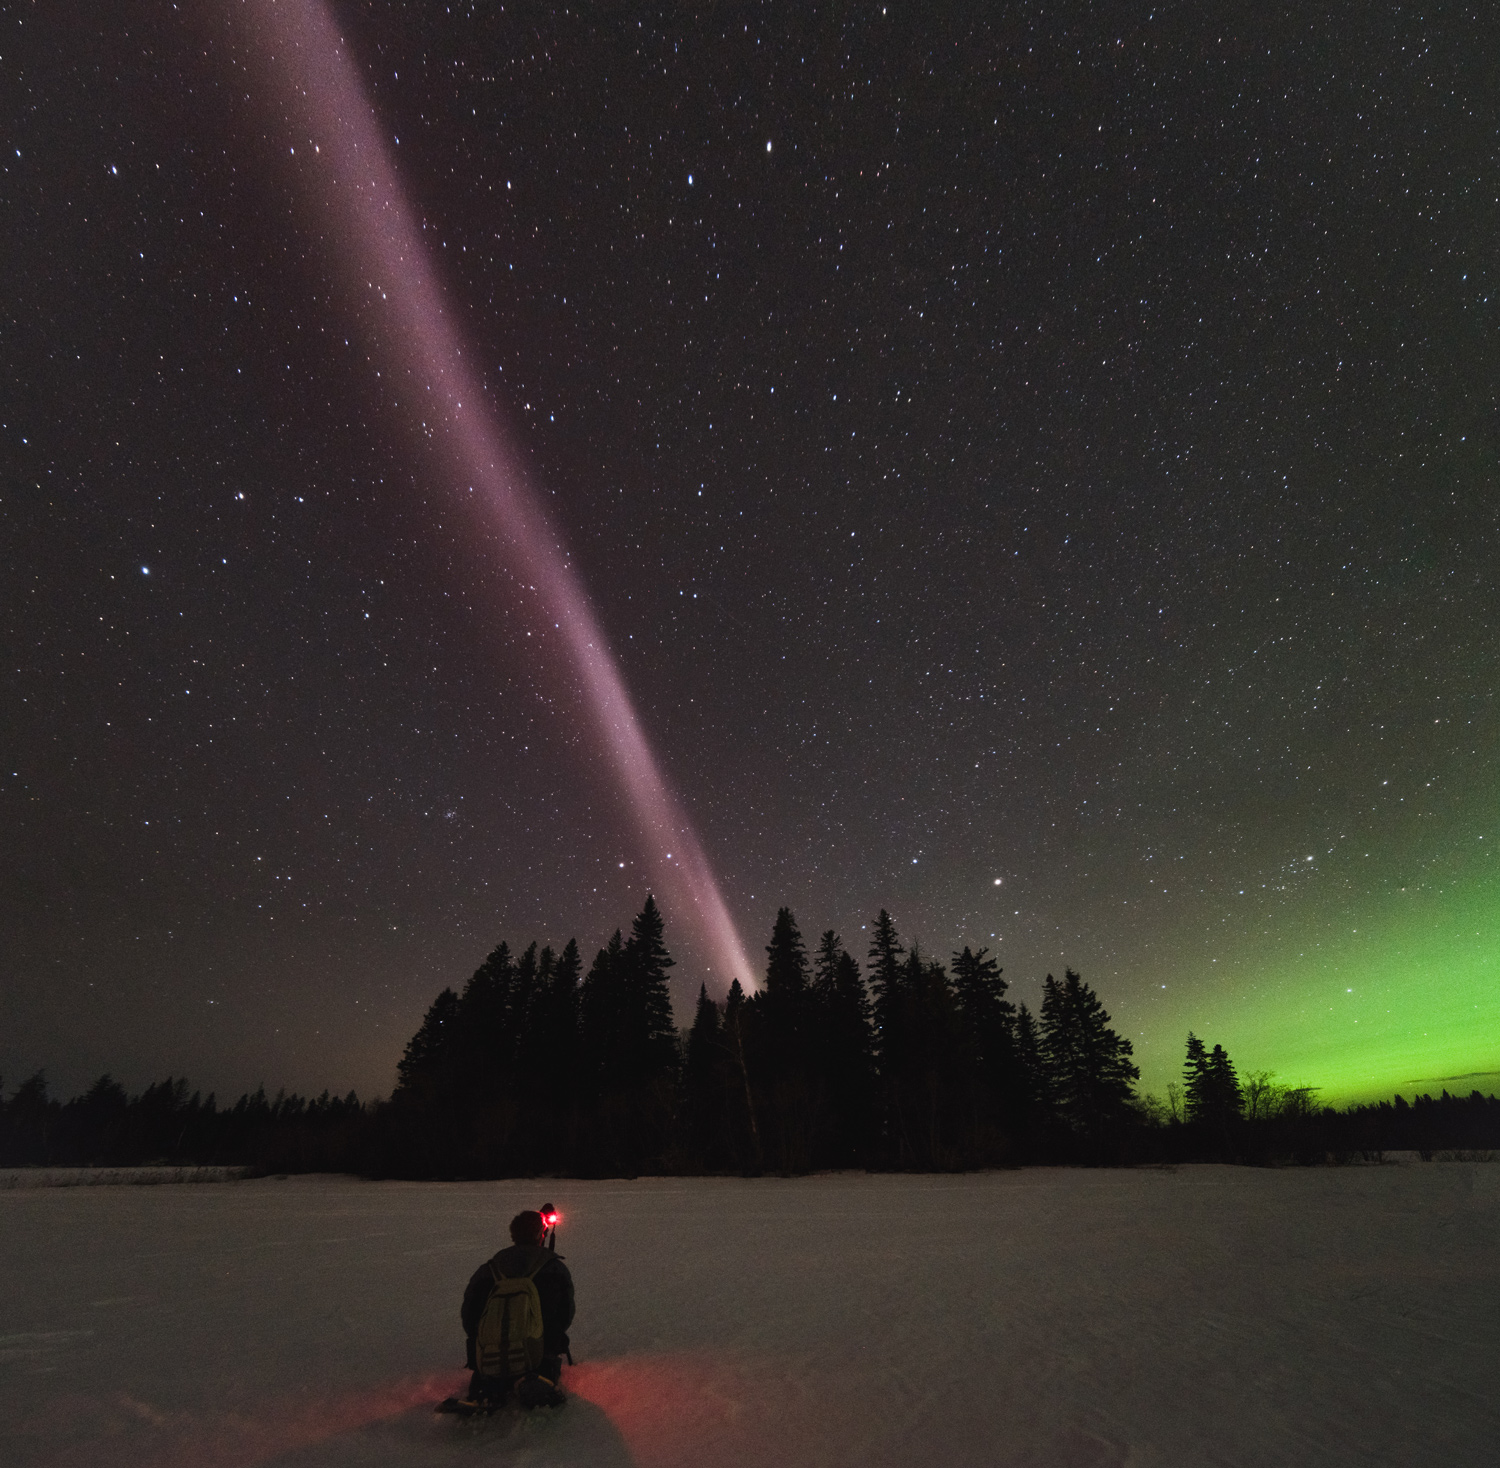
| Figure 1. Alberta Aurora Chasers capture STEVE, the new-to-science upper atmospheric phenomenon, on the evening of April 10, 2018 in Prince George, British Columbia, Canada. Fellow Aurora Chaser Robert Downie kneels in the foreground while photographer Ryan Sault captures the narrow ribbon of white-purple hues overhead. Credit: Ryan Sault. |
Results
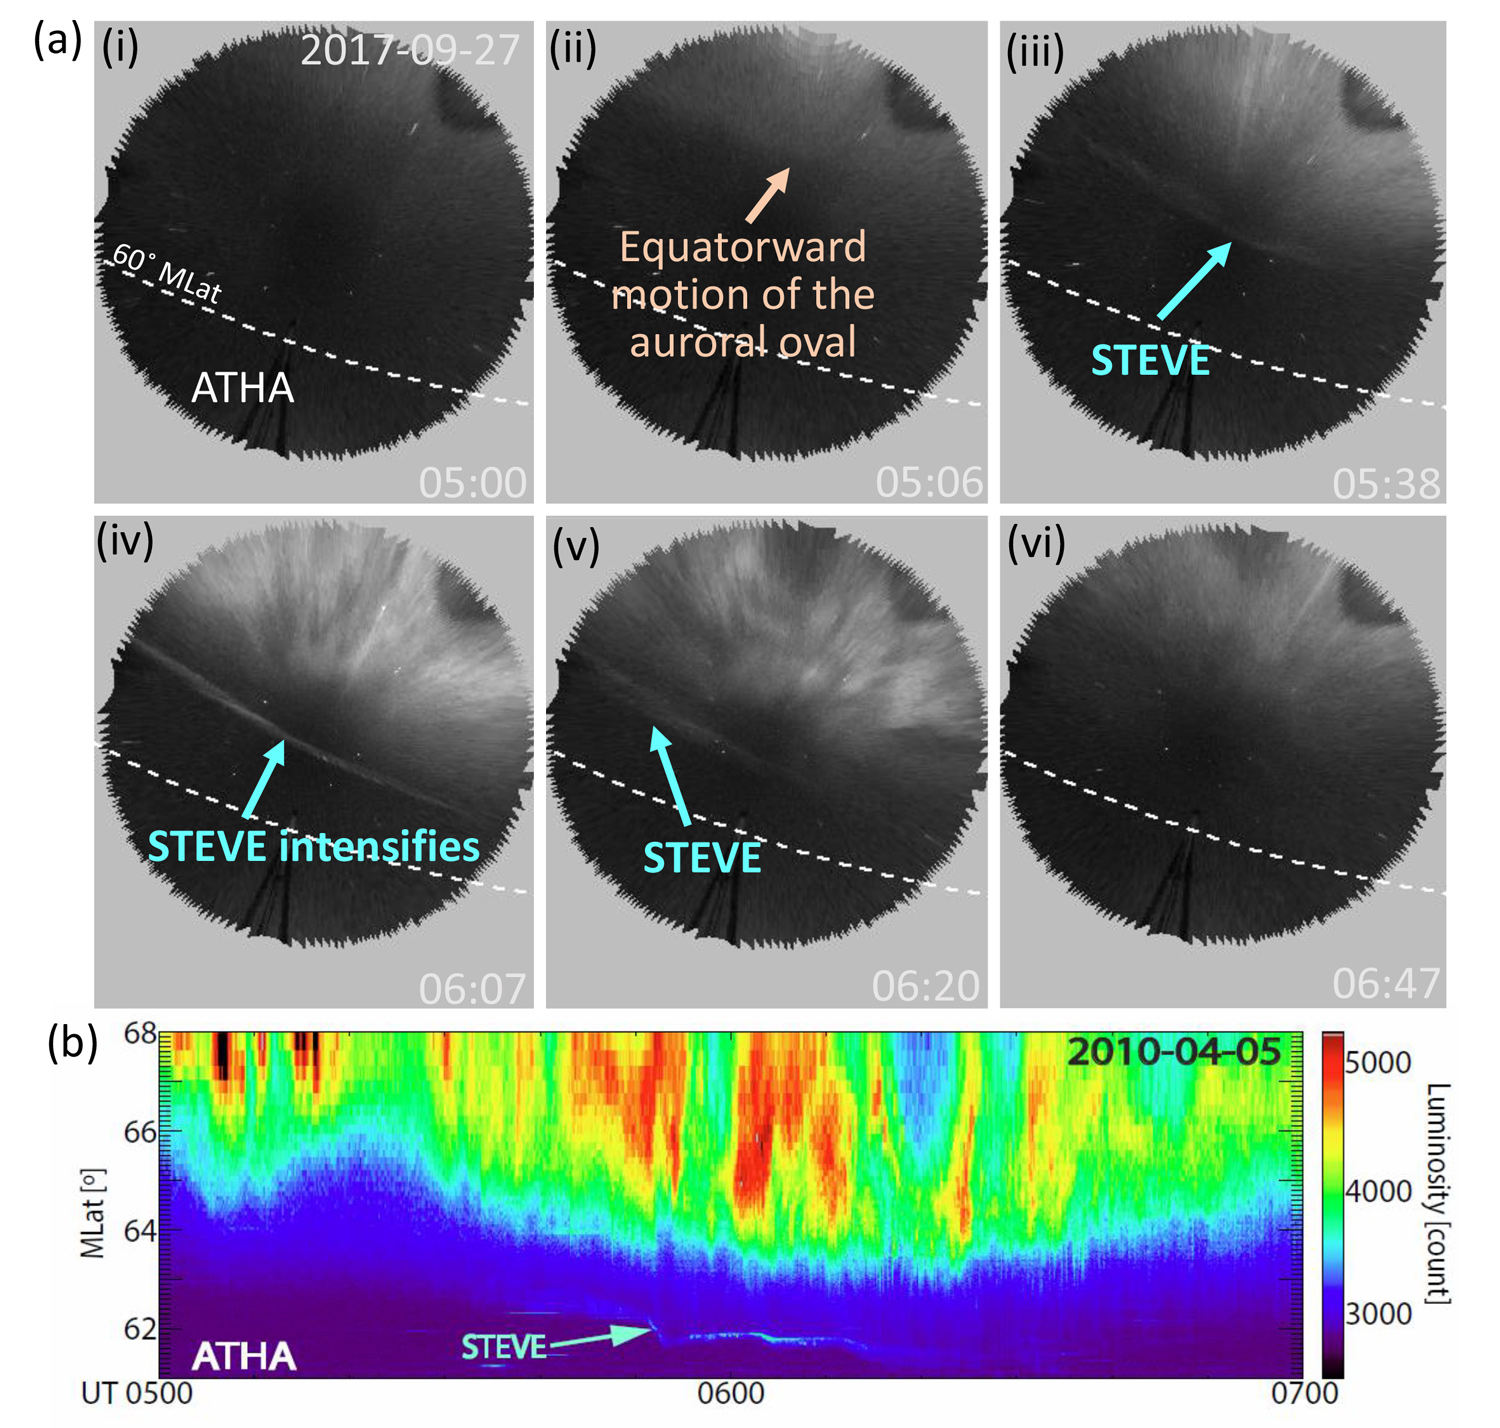
We performed a statistical analysis of 28 STEVE events identified through THEMIS ASI and the REGO database. On average, STEVE lasted for about one hour, with a latitudinal width of ~20km in the ionosphere. The structure also showed an equatorward latitudinal displacement of about 50 km on average during its entire duration. STEVE’s longitudinal extent was more than two thousand kilometers across North America, but this calculation was limited by the ASI field-of view. Figure 1 shows an example of one of the STEVE events identified in THEMIS ASI. As shown below, STEVE lasted about one hour and covered the entire field-of-view of the ASI. The keogram (panel b) illustrates the equatorward motion that was typically observed for STEVE events.
|
| Figure 2. STEVE event observed using THEMIS ASI on April 05, 2010. (a) Temporal evolution of STEVE observed at Athabasca (ATHA) ASI. The white dashed contour corresponds to 60° magnetic latitude. (b) Keogram summarizing the event. |
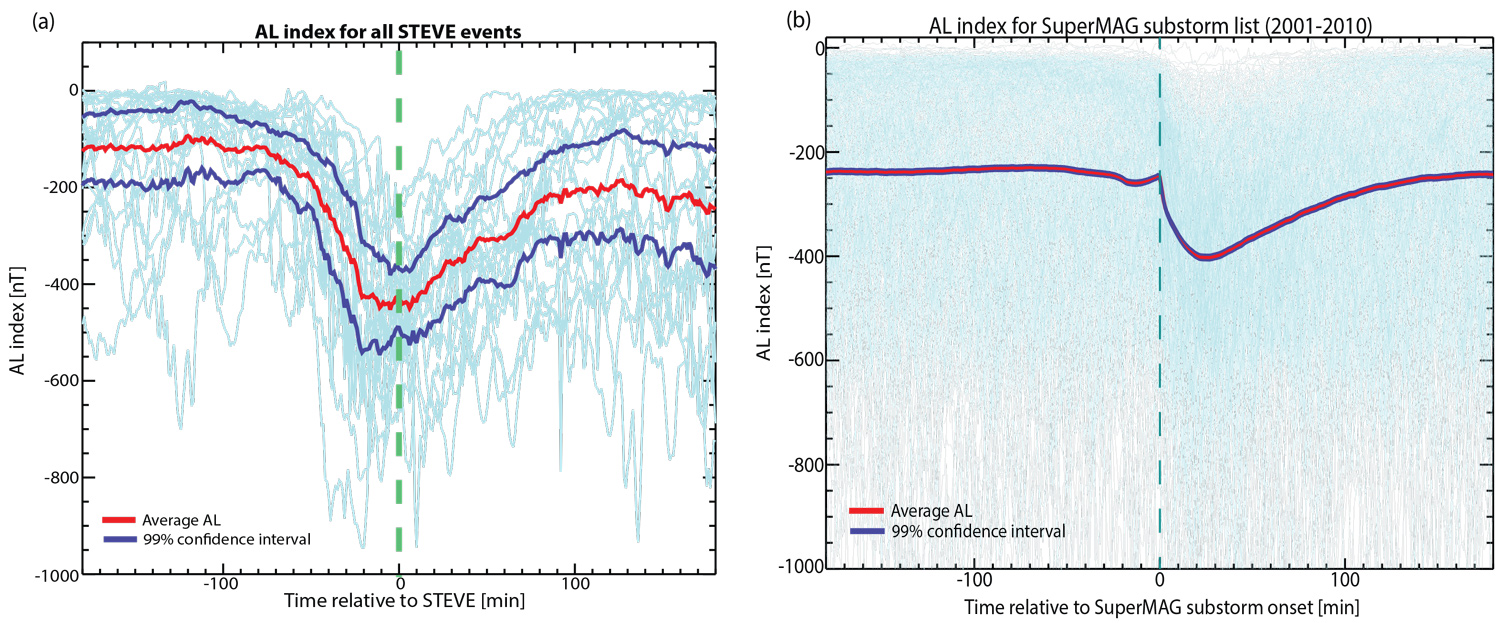
We performed a superposed epoch analysis with the AL index for the STEVE events reported in the study and found that STEVE occurred about one hour after substorm onset at the end of a prolonged expansion phase. Figure 2 [adapted from Gallardo-Lacourt et al., 2018] depicts the AL index for the STEVE events (left panel) and the average AL index for 16k substorms from the SuperMAG database. This result suggested that for STEVE to be observed, a large number of the injections must occur in the plasma sheet, creating a possibility that these injections effectively increase the ring current pressure and further enhance the subauroral westward flows.
|
| Figure 3. Superposed epoch analysis of (a) 28 STEVE events and (b) substorms identified by SuperMAG dataset. Red lines indicate the average and blue lines indicate the 99% confidence interval. The vertical green dashed line corresponds to (a) the time when STEVE is initially observed in the ASI data and (b) substorm onset. |
Conclusion
We performed the first statistical analysis on STEVE based on 28 events identified using THEMIS ASI and the REGO database. We characterized STEVE’s optical characteristics by calculating its width, latitudinal displacement, duration, and longitudinal coverage. We showed that STEVE typically occurs about one hour after substorm onset and is an extremely narrow structure with only ~20 km in latitude. Its longitudinal extent is at least ~2145 km with an average duration of about one hour.
Reference
Gallardo-Lacourt, B., Nishimura, Y., Donovan, E., Gillies, D. M., Perry, G. W., Archer, W. E., et al. (2018). A statistical analysis of STEVE. Journal of Geophysical Research: Space Physics, 123, 9893– 9905. https://doi.org/10.1029/2018JA025368Biographical Note
...
 Please send comments/suggestions to
Emmanuel Masongsong / emasongsong @ igpp.ucla.edu
Please send comments/suggestions to
Emmanuel Masongsong / emasongsong @ igpp.ucla.edu