

2018 THEMIS SCIENCE NUGGETS
Effect of large-scale convection on evolution of plasma sheet plasma bubble: RCM simulations
by Chih-Ping Wang
UCLA AOS
Introduction
Observational studies showed that the plasma sheet flows include slower large-scale convection flows [e.g., Angelopoulos et al., 1993] and sporadically faster mesoscale (in a time scale of a few to ~15 min and a spatial scale of a few RE in the azimuthal direction) flows. The fast mesoscale flows are commonly referred to as bursty bulk flows (BBFs) [e.g., Angelopoulos et al., 1992] and are often associated with a plasma bubble that has relatively lower total flux tube entropy (S = P·Vol5/3, where P is plasma pressure and Vol is the flux tube volume per unit magnetic flux) than that of the surrounding plasma. Earthward transport of a bubble alters the spatial distributions of entropy, plasma and fields, and field-aligned currents in the near-Earth plasma sheet and inner magnetosphere. There are many factors that can affect the evolution of a plasma bubble, in this study we use the UCLA version of Rice Convection Model (RCM) to investigate the effect of the background large-scale convection flows on bubbles starting from different MLT locations in the tail (Wang et al., 2018).
|
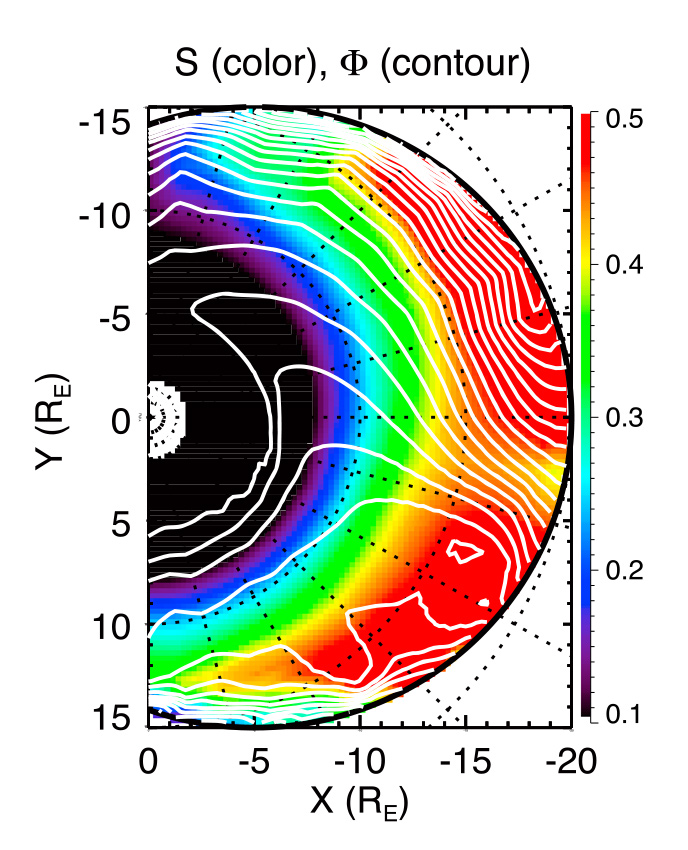
| Figure 1. Simulated equatorial distributions of the background large-scale convection flow (white contours) and S (colors) for a quasi-steady state plasma sheet under strong convection (the cross polar-cap potential is 90 kV). |
Simulations
We conduct 3 parameter-controlled simulations, in which we initiate the bubble from three different initial MLT locations (Run 1: centered at 0 MLT; Run 2: at 23 MLT, Run 3: at 01 MLT, bubble initial width is 1 MLT) at the RCM tail boundary (X ~ –20 RE). Figure 1 shows simulated quasi-steady background convection flows (white contours) and S distribution (colors) before the bubble is initiated. This background convection, which is driven externally by φPC = 90 kV, is directed mainly earthward, but with a substantial dawnward component that becomes stronger at later MLTs. The convection speeds are stronger in the post-midnight sector than the pre-midnight sector. This azimuthal convection component is a result of the shielding electric field that prevents particles from moving further earthward, and the dawn-dusk convection asymmetry is due to higher auroral conductance in the post-midnight sector. This background convection pattern is similar to those inferred from statistical analysis of observed plasma sheet flows (e.g., Wang et al., 2007).
|
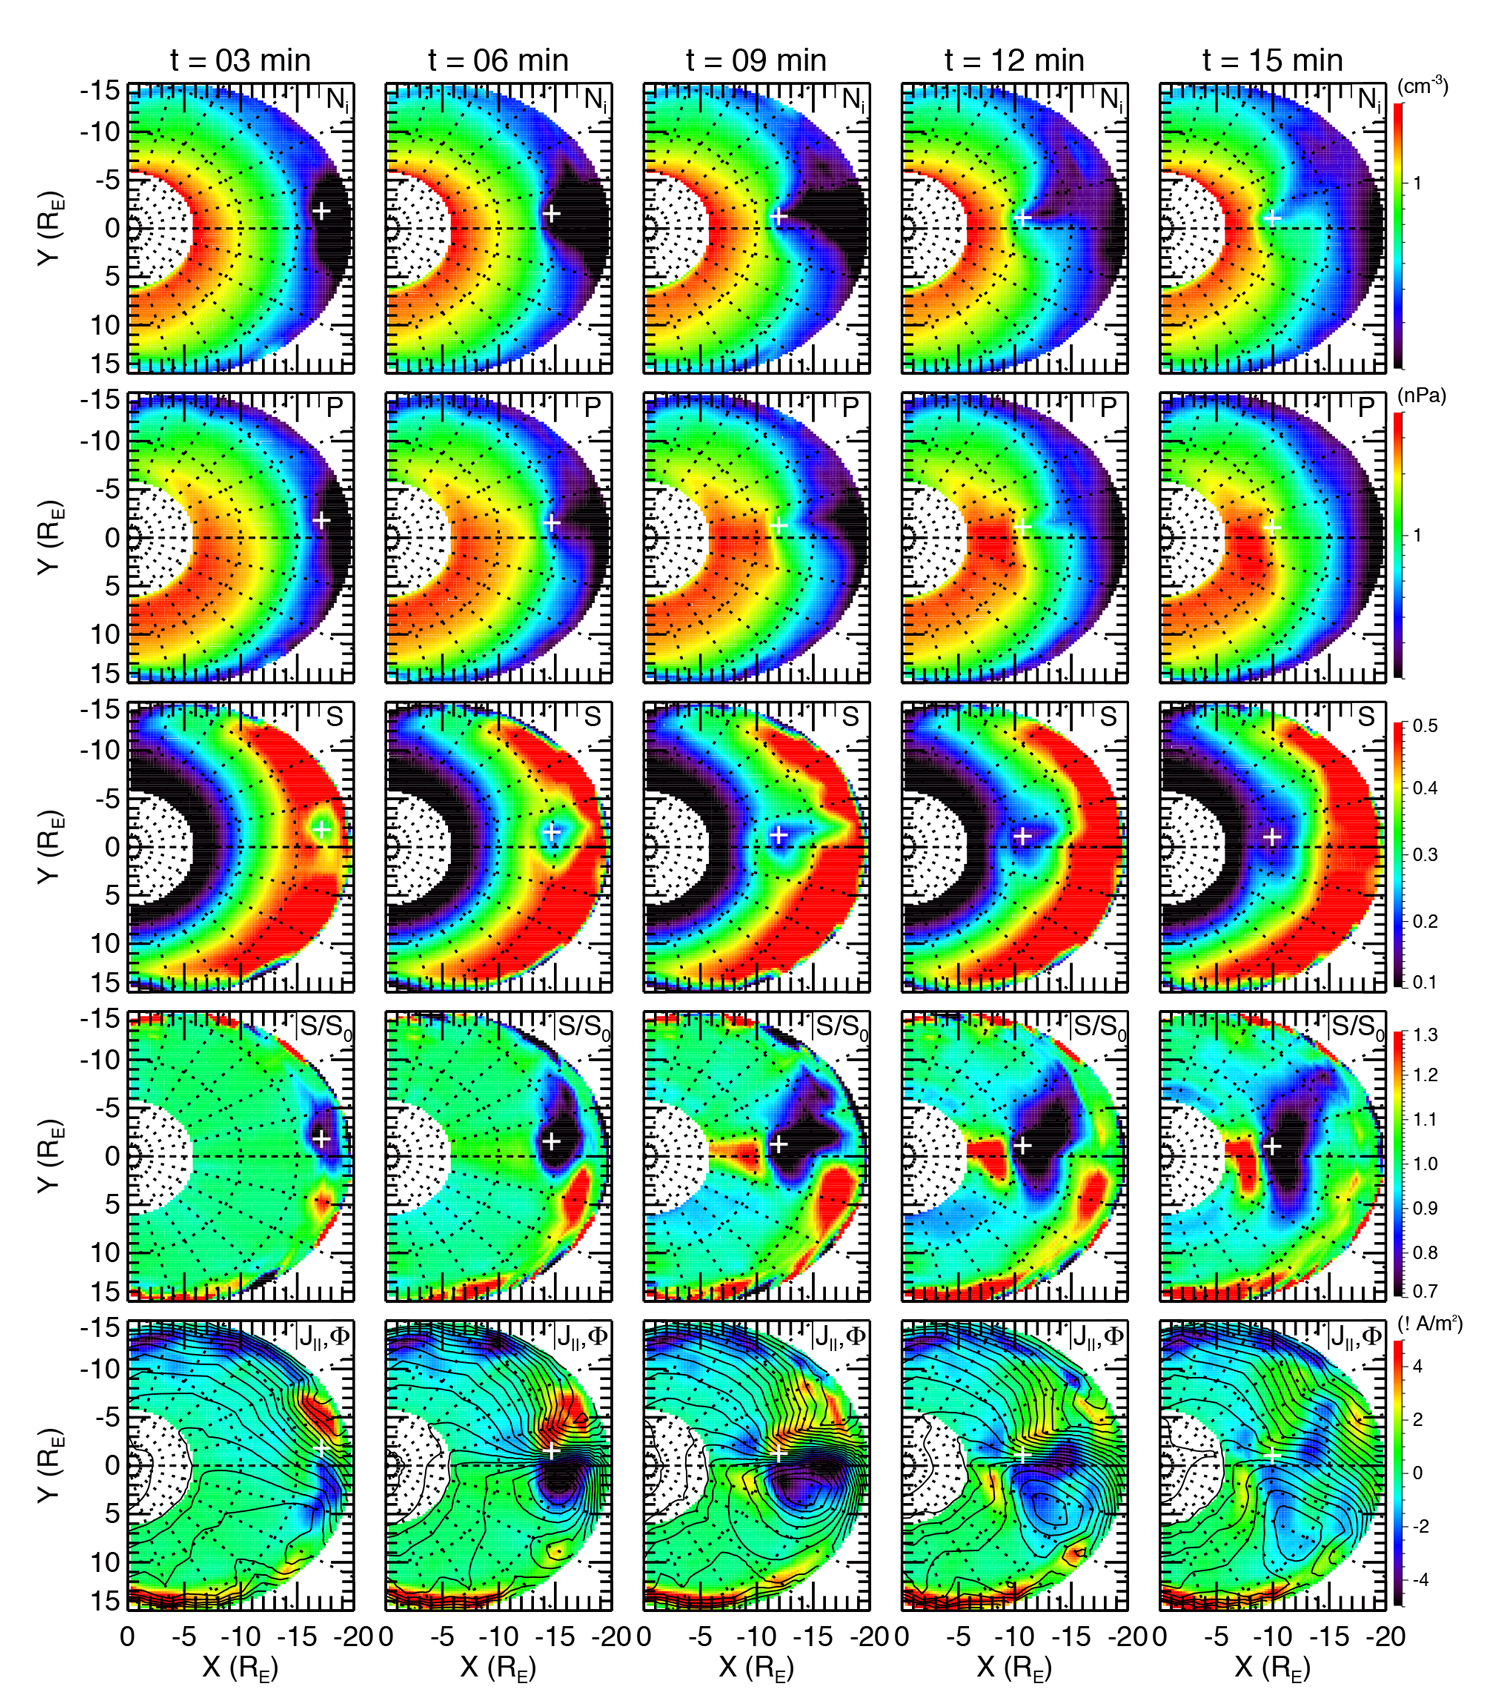
| Figure 2. From top to bottom: Equatorial distributions of proton number density, plasma pressure, S (nPa-(RE/nT)5/3), S/S0 (S0 is S at t = 0), and J∥ and Φ (contours, every 4 kV) at different times for run 1. |
Figure 2 shows the evolution of equatorial plasma density, plasma pressure, and S from run 1 (the bubble from 0 MLT, bubble is initiated at t = 0). The inward motion of the particles within the initial bubble results in decreases in density, pressure, and S. The S changes are indicated by the ratios of S to the S at t = 0 (S0). The region of reduced S is seen to first move radially earthward while extending slightly toward dawn. Later the earthward end of the S reduction extends duskward at smaller radial distances. The azimuthal width of this S reduction eventually expands to ~4 MLT at t = 15 min, considerably wider than the bubble’s initial width of 1 MLT. After t ~2-3 min, a local S minimum (Smin), as indicated by the white or black cross, is formed within the S reduction region. The Smin moves inward almost radially near the midnight meridian. The bottom plots of Figure 2 show that a FAC pair is formed on the two sides of the Smin, with downward (upward) currents to the ionosphere on the dawnside (duskside) of the Smin. In response to the FAC pair, Φ spatial distribution alters substantially in the S reduction region with the electric field strongly enhanced in the vicinity of the Smin.
|
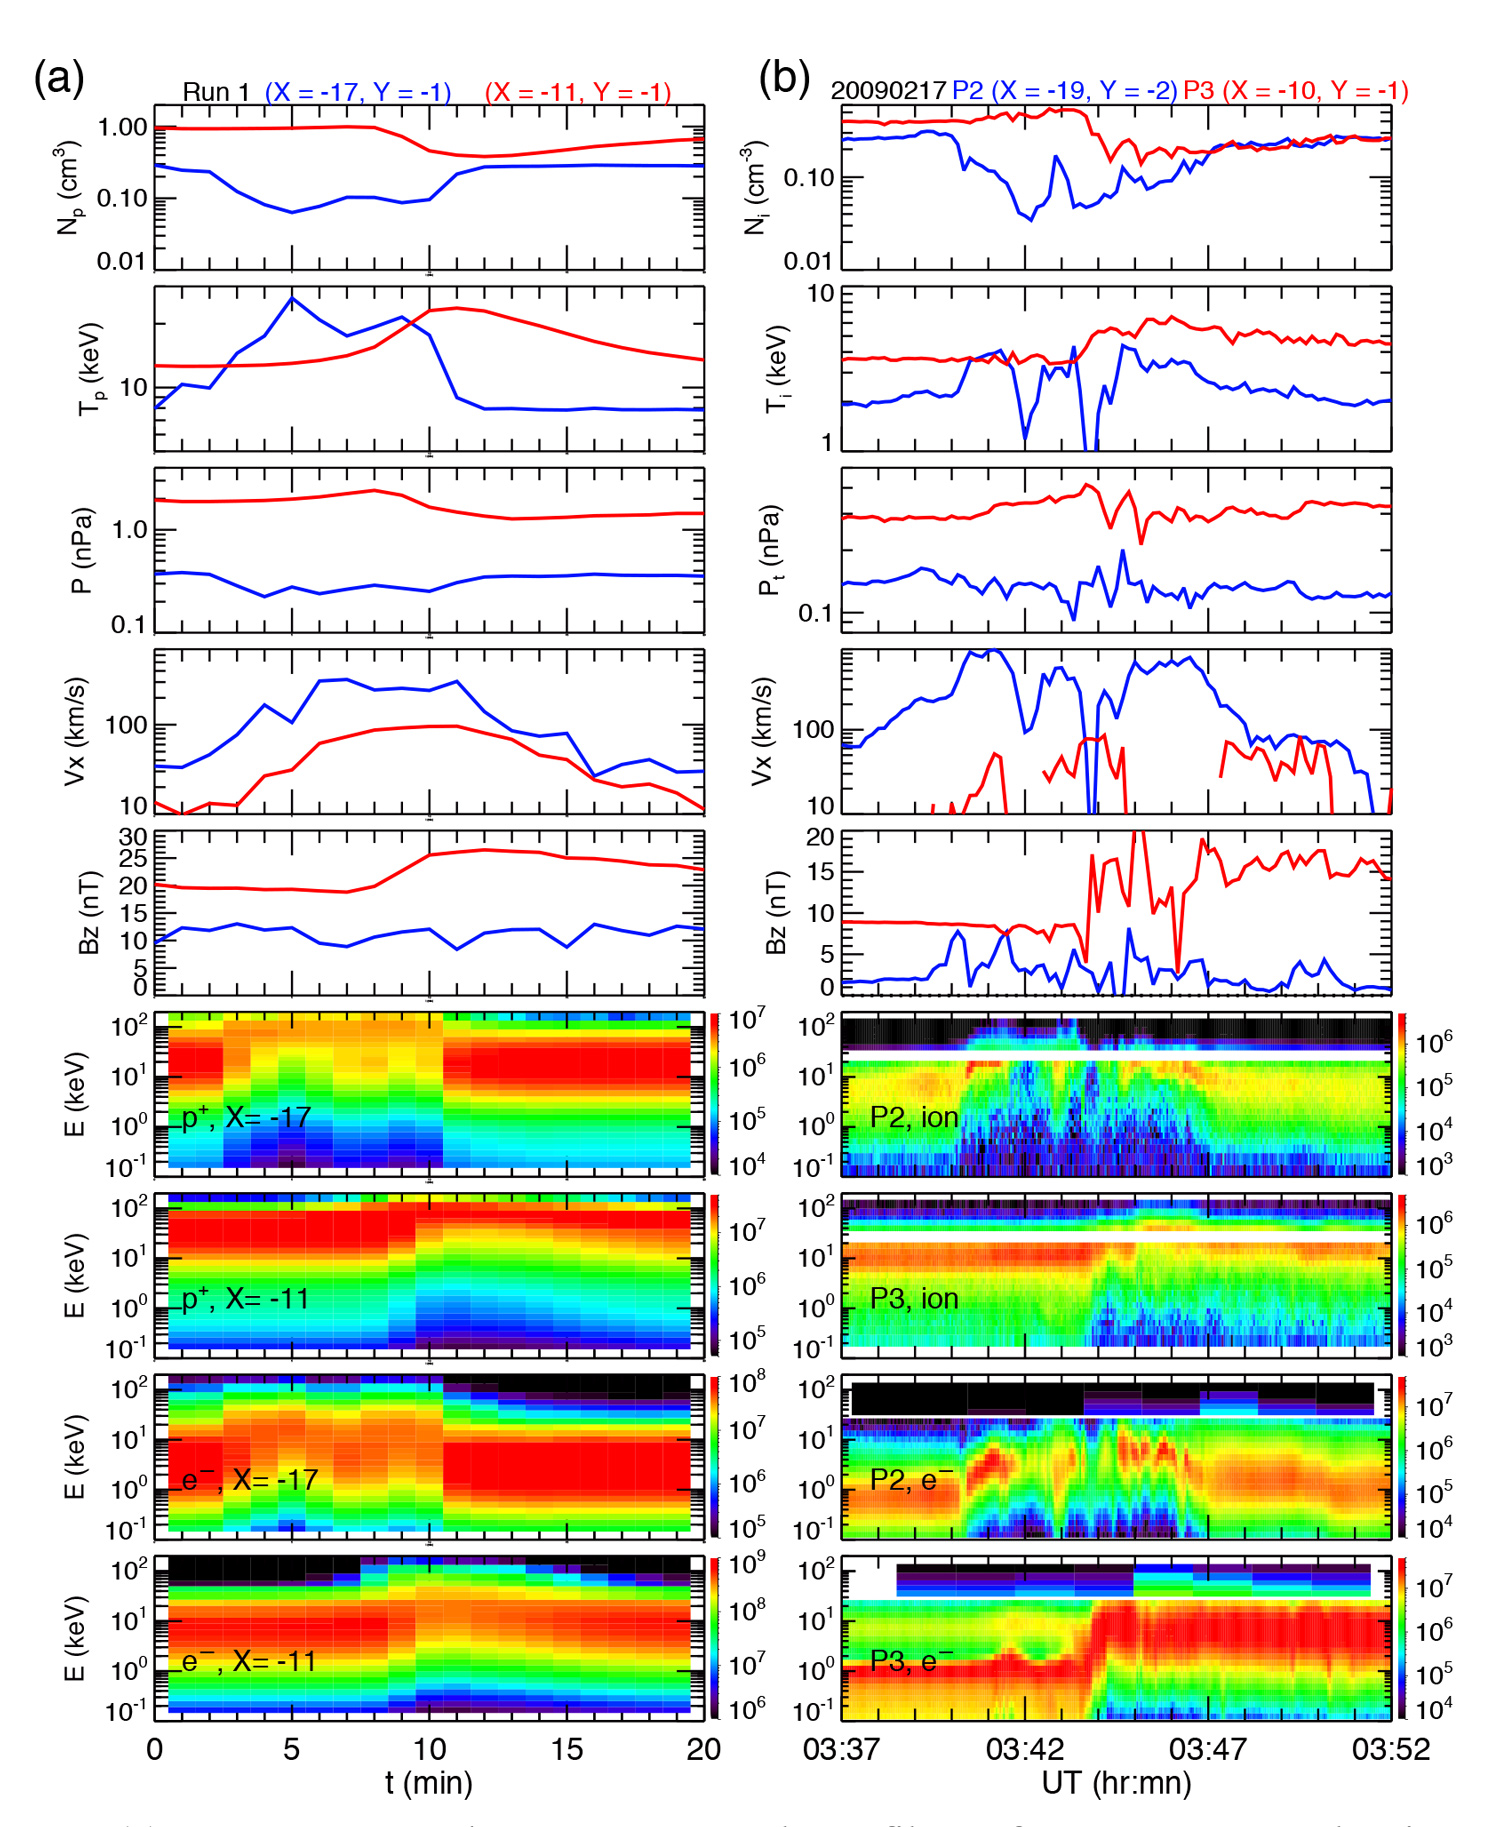
| Figure 3. (a) From top to bottom: temporal profiles of RCM proton density, proton temperature, plasma pressure, earthward bulk flow speed, Bz at X = –17 (blue) and X = –11 RE (red), proton energy fluxes at X = –17 and –11 RE, and electron energy fluxes X = –17 and –11 RE. (b) From top to bottom: temporal profiles of THEMIS proton density, proton temperature, plasma pressure, earthward bulk flow speed, Bz observed by P2 at X = –19 (blue) and by P3 at X = –10 RE (red), proton energy fluxes (keV/(cm2-s-sr-keV)) at X = –19 and –10 RE, and electron energy fluxes (keV/(cm2-s-sr-keV)) at X = –19 and –10 RE. |
Figure 3 compares the simulated bubble from run 1 with a THEMIS event. The left panels of Figure 3 show the temporal variations of simulated plasma and magnetic field at two X locations, X = –17 (blue lines) and X = –11 RE (red lines) near midnight at Y = –1 RE (approximately the Y locations of the Smin trace). A sharp plasma change of ~10 min with a density decrease and a temperature increase is seen first at X = –17 RE at t = 2 min and later at X = –11 RE at t ~7 min. These plasma changes are associated with decreases in the particle numbers at thermal to lower energies but increases at higher energies. The plasma changes are accompanied by enhanced earthward flow speeds with speeds higher at larger radial distances. The magnetic field change at X = –17 RE is small, but a strong Bz enhancement is seen at X = –11 RE. For comparison, the right panels of Figure 3 show an event of an isolated BBF on 17 February 2009 observed by two THEMIS probes, P2 and P3. The two probes were at two radial distances near midnight (Y ~ –1 to –2 RE). P2 at X ~ –19 RE observed the BBF about 4 min earlier than did P3 at X ~ –10 RE. The observed changes in plasma moments, flow speeds, magnetic fields, and particle energy spectrum at these two radial locations are in a good qualitative agreement with the simulation profiles.
|
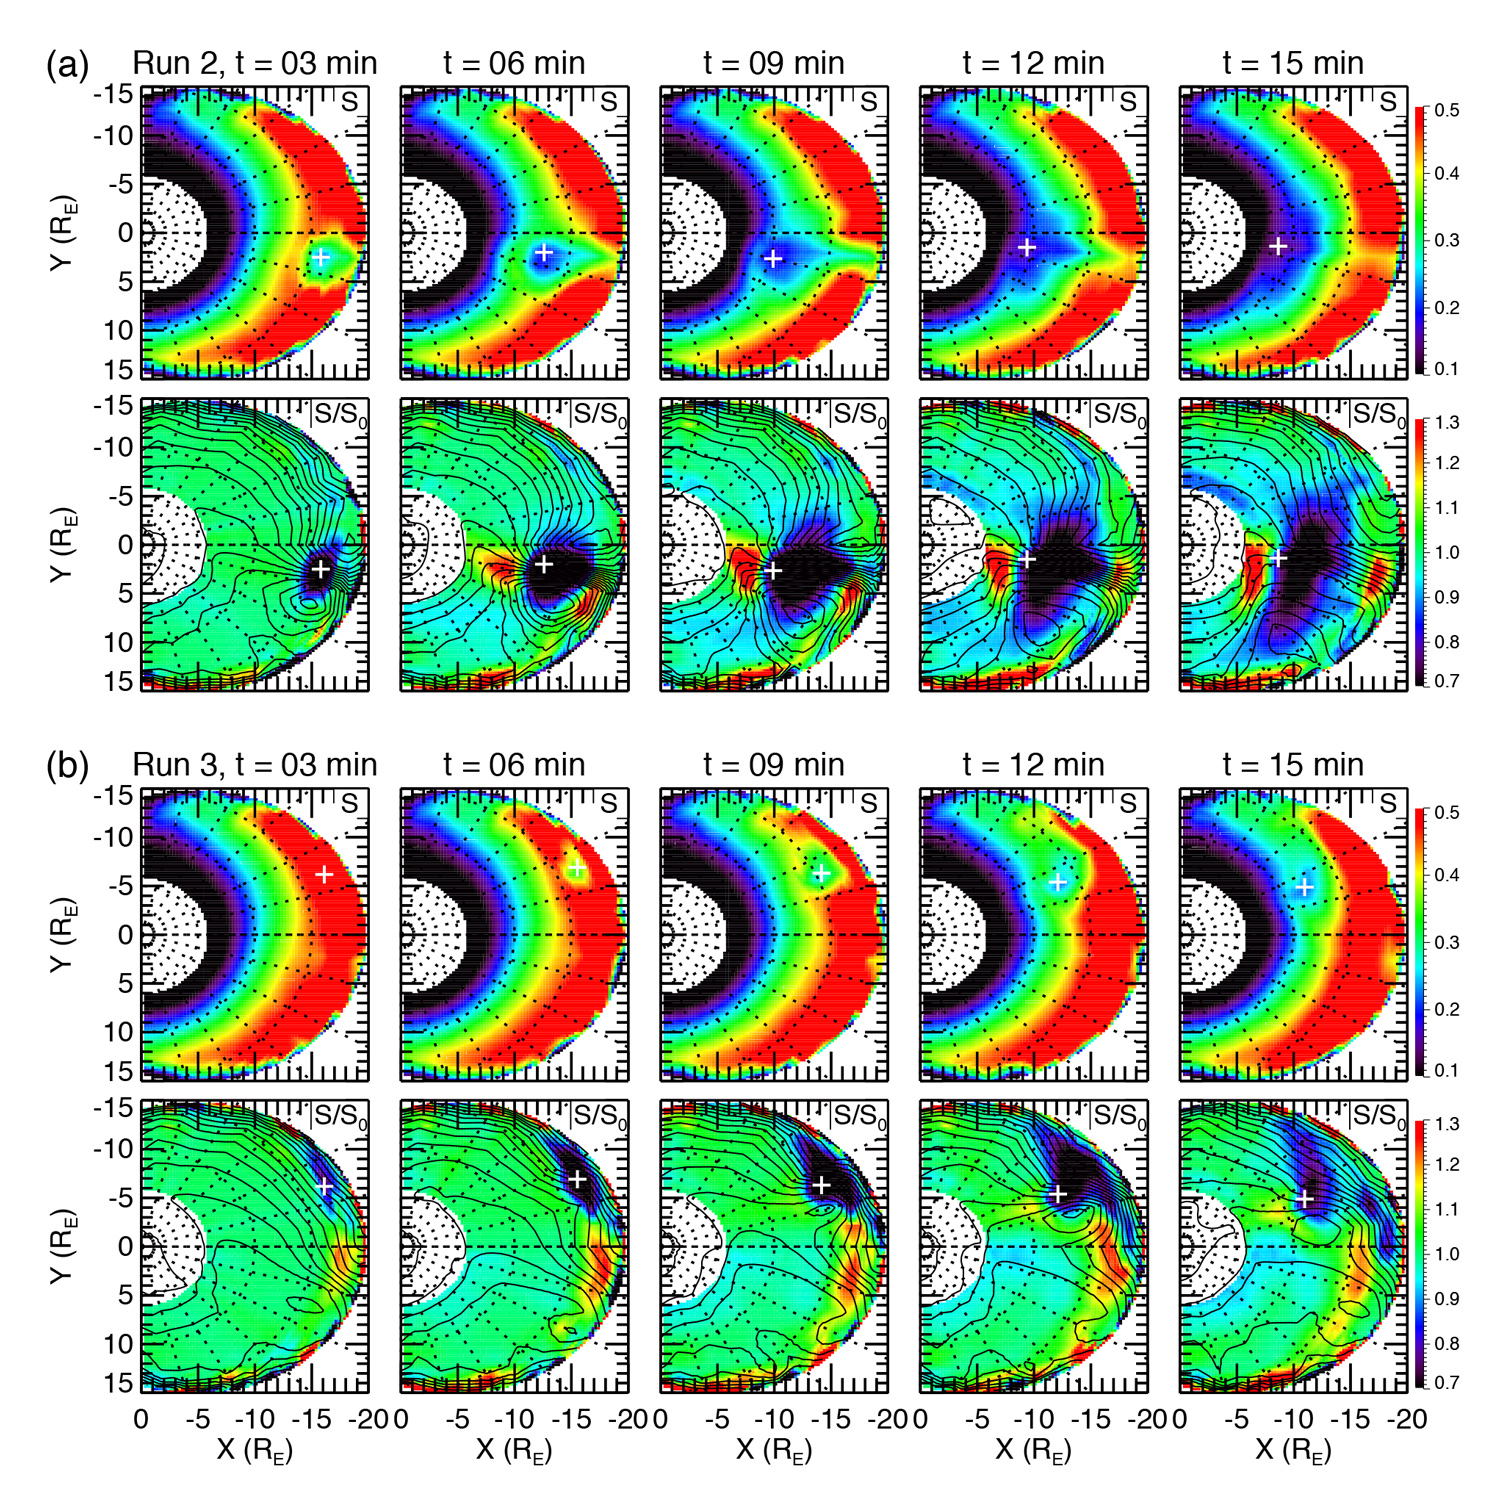
| Figure 4. Equatorial distributions of S (nPa-(RE/nT)5/3) and S/S0 at different times for (a) run 2 and (b) run 3. |
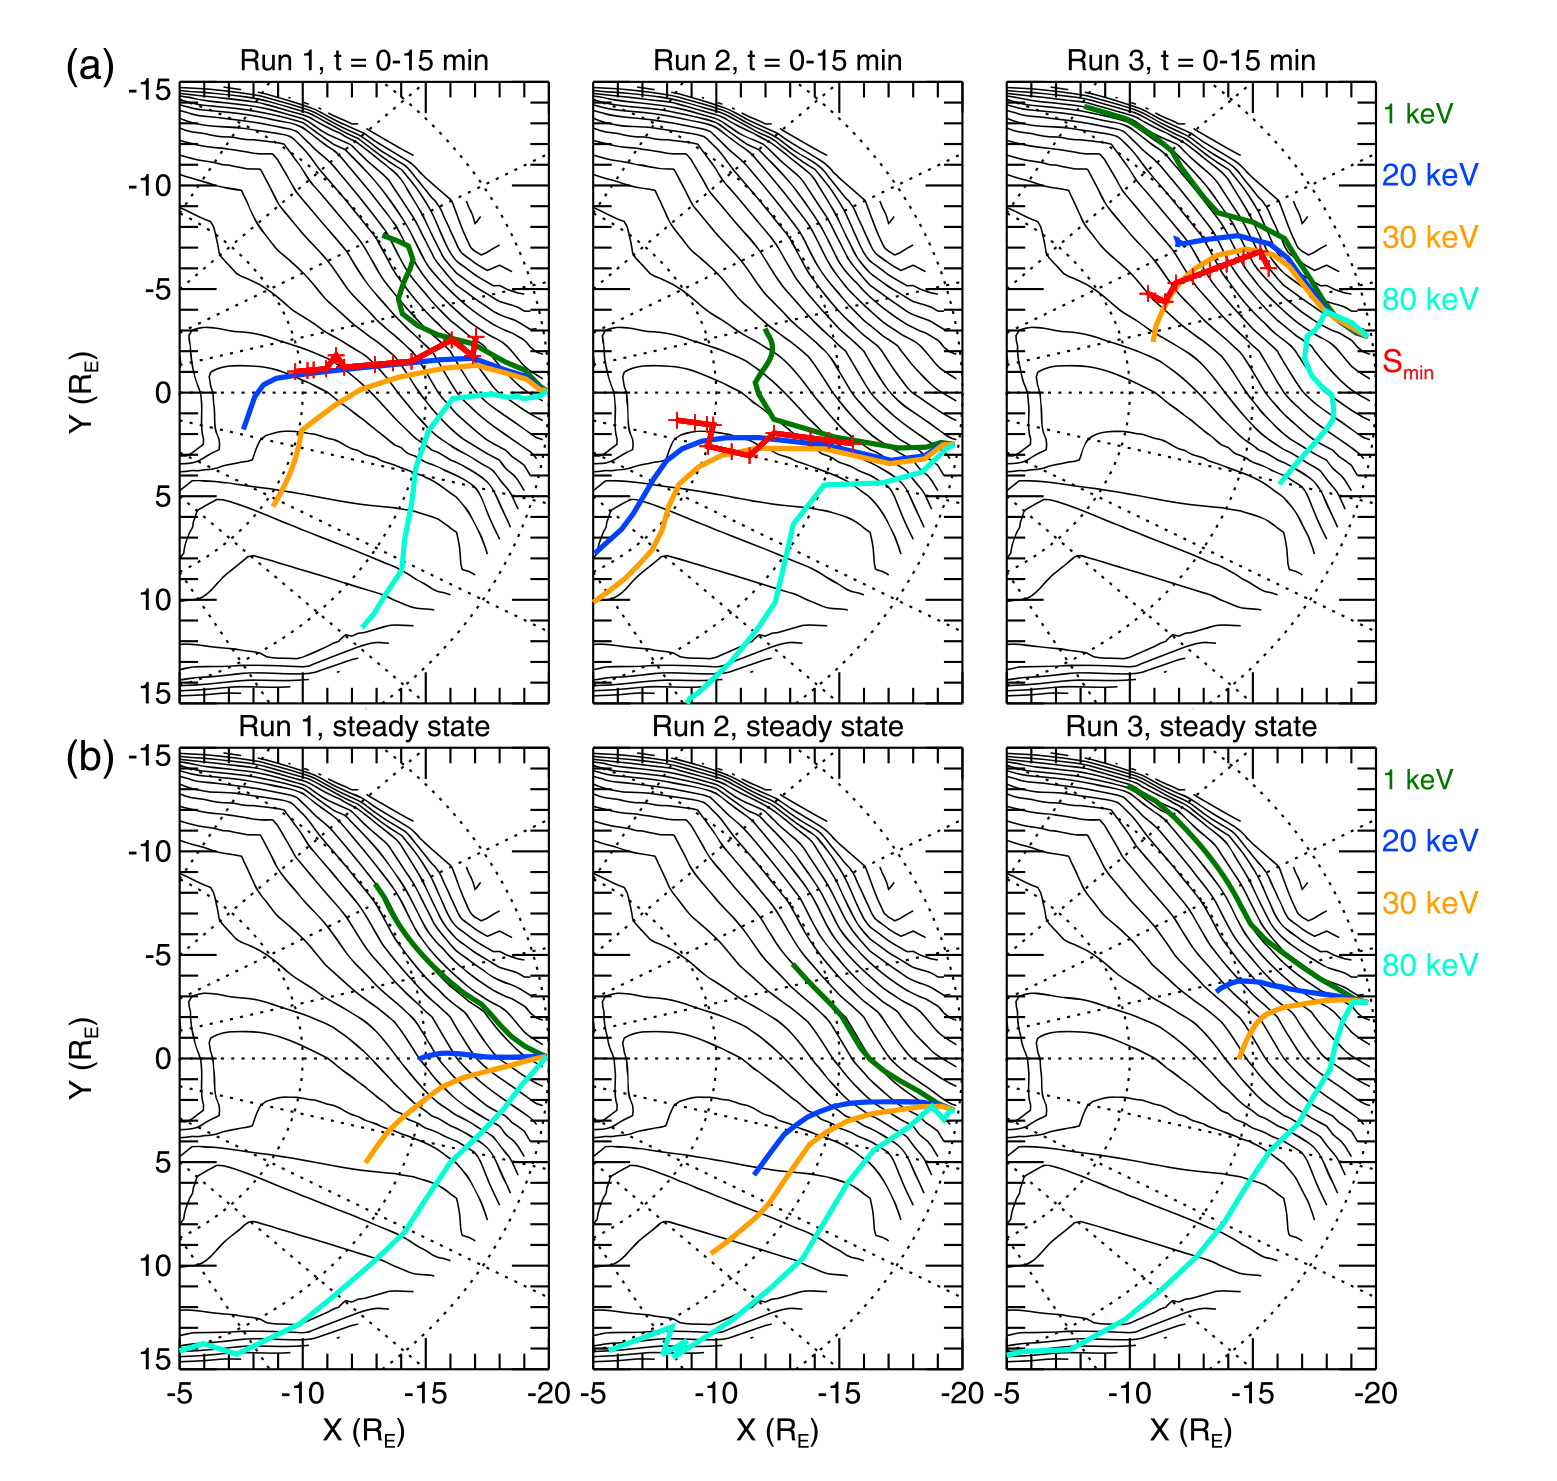
Figure 4 shows the evolution of equatorial S and S/S0 from runs 2 (bubble from 23 MLT) and run 3 (bubble from 01 MLT). Despite that the bubble’s initial locations in runs 2 and 3 are merely 1 MLT away from that of run 1, the radial and azimuthal extents of the resulting S reductions differ quite significantly. The S reduction in run 2 has the largest azimuthal width covering MLTs from ~19 to 2. In contrast, the S reduction in run 3 only covers MLT from ~1 to 4. The earthward front of the S reduction reaches r ~8 RE in run 2 and r ~9 RE in run1, but only r ~12 RE in run 3. This difference is due to the dawn-dusk asymmetry in the background convection flow shown in Figure 1. Figure 5a shows particle drift trajectories from t = 0 to 15 min for protons of 4 different energy invariants (corresponding to Ek = 1, 20, 30, and 80 keV at X = –20 and Y = 0 RE) for runs 1, 2, and 3. The black contours are the background large-scale convection as shown in Figure 1. Figure 5b shows drift trajectories under background flows for comparisons. As shown in Figure 5a, within the first 3 min, particles of different energies move earthward along paths that are squeezed together, which are quite different from their steady-state paths shown in Figure 5b, particularly so for higher energy protons. As these particles move to smaller radial distances, their paths start to divert substantially from each other with protons of higher energies going more azimuthally toward dusk. Since the lower energy protons (e.g., 1 keV) drift toward dawn, they result in the dawnward expansion of the S reduction seen in Figures 2 and 4, while duskward drift of higher energy protons (e.g., 20 and 30 keV) contributes to the duskward expansion of the S reduction. Higher energy protons in run 2 are able to divert farther away from lower energy protons than in run 3 because of the weaker background convection in the pre-midnight than post-midnight sector, thus the resulting S reduction extends azimuthally wider in run 2.
|
| Figure 5. (a) Equatorial distributions of Φ (contours, every 4 kV) at t = 0, particle trajectories for protons of different energy invariants and trace of Smin from t = 0 to 15 min for runs 1-3. (b) Particle trajectories for 15 min within the steady-state electric and magnetic fields. |
Conclusion
We presented the RCM simulations to show how the evolution of a plasma sheet bubble starting from different initial MLT locations in the tail is affected by the background large-scale convection. Both observations and simulations show that large-scale convection has a dawn-dusk asymmetry in flow speeds and directions. As a plasma bubble moves earthward, the azimuthal width of the bubble’s S reduction becomes substantially wider than the initial width due to ion azimuthal drift of different energies. The radial and azimuthal extents of the S reduction depend strongly on the bubble’s initial MLT location. The plasma bubble starting at 23 MLT results in an S reduction that extends closer to the Earth and azimuthally wider than does the bubble starting at 01 MLT. This difference in the azimuthal extent is mainly due to the weaker background convection in the pre-midnight sector, allowing magnetic drift to expand the S reduction further azimuthally for the bubble starting at 23 MLT.
Reference
Wang, C.-P., Gkioulidou, M., Lyons, L. R., & Wolf, R. A. (2018). Spatial distribution of plasma sheet entropy reduction caused by a plasma bubble: Rice Convection Model simulations. Journal of Geophysical Research: Space Physics, 123. https://doi.org/10.1029/2018JA025347Angelopoulos, V., W. Baumjohann, C. F. Kennel, F. V. Coroniti, M. G. Kivelson, R. Pellat, R. J. Walker, H. Lühr, and G. Paschmann (1992), Bursty bulk flows in the inner central plasma sheet, J. Geophys. Res., 97(A4), 4027–4039, doi:10.1029/91JA02701.
Angelopoulos, V., C. F. Kennel, F. V. Coroniti, R. Pellat, H. E. Spence, M. G. Kivelson, R. J. Walker, W. Baumjohann, W. C. Feldman, J. T. Gosling, C. T. Russell (1993), Characteristics of ion flow in the quiet state of the inner plasma sheet, Geophys. Res. Lett., 20, 1711–1714.
Wang, C.-P., L. R. Lyons, T. Nagai,J. M. Weygand, and R. W. McEntire (2007), Sources, transport, and distributions of plasma sheet ions and electrons and dependences on interplanetary parameters under northward interplanetary magnetic field, J. Geophys. Res., 112, A10224, doi:10.1029/2007JA012522, 2007.
Biographical Note
Chih-Ping Wang is a Researcher in Dept. of Atmospheric and Oceanic Sciences at UCLA. His main research interests are the Earth’s mid-tail dynamics, particle sources and transport within the plasma sheet, the low-latitude boundary layer, the magnetosphere-ionosphere coupling, ring current physics, ULF waves, and reconnection.
 Please send comments/suggestions to
Emmanuel Masongsong / emasongsong @ igpp.ucla.edu
Please send comments/suggestions to
Emmanuel Masongsong / emasongsong @ igpp.ucla.edu