

2020 THEMIS SCIENCE NUGGETS
Plasmapause surface wave oscillates the magnetosphere and diffuse aurora
by Fei He
Key Laboratory of Earth and Planetary Physics
Institute of Geology and Geophysics, Chinese Academy of Sciences, Beijing, China
Introduction
Energy circulation in geospace lies at the heart of space weather research. In the inner magnetosphere, the steep plasmapause boundary separates the cold dense plasmasphere, which corotates with the planet, from the hot ring current/plasma sheet outside. Theoretical studies suggested that plasmapause surface waves related to the sharp inhomogeneity exist and act as a source of geomagnetic pulsations, but direct evidence of the waves and their role in magnetospheric dynamics have not been captured before our study.
When the interplanetary magnetic field (IMF) has a southward component, the mass and energy in the solar wind is transported into the magnetosphere and a substantial portion of the energy would eventually be released into the ionosphere and upper atmosphere, generating spectacular auroras in the Earth's polar regions. In our study, we employed multi-satellite and ground-based measurements to construct the general scenario of the magnetospheric dynamics relevant to the plasmapause surface wave (PSW), as shown in Figure 1. This study shows direct observations of a plasmapause surface wave excited by plasma injection and its impacts during a geomagnetic storm. The wave oscillates the plasmapause in the afternoon-dusk sector, triggers sawtooth auroral displays, and drives outward-propagating ultra-low frequency waves. Statistical results indicate that this is a systematic and crucial process in driving energy dissipation in planetary space environments.

|
| Figure 1. Artistic illustration of the plasmapause surface wave. |
Evidence of PSW
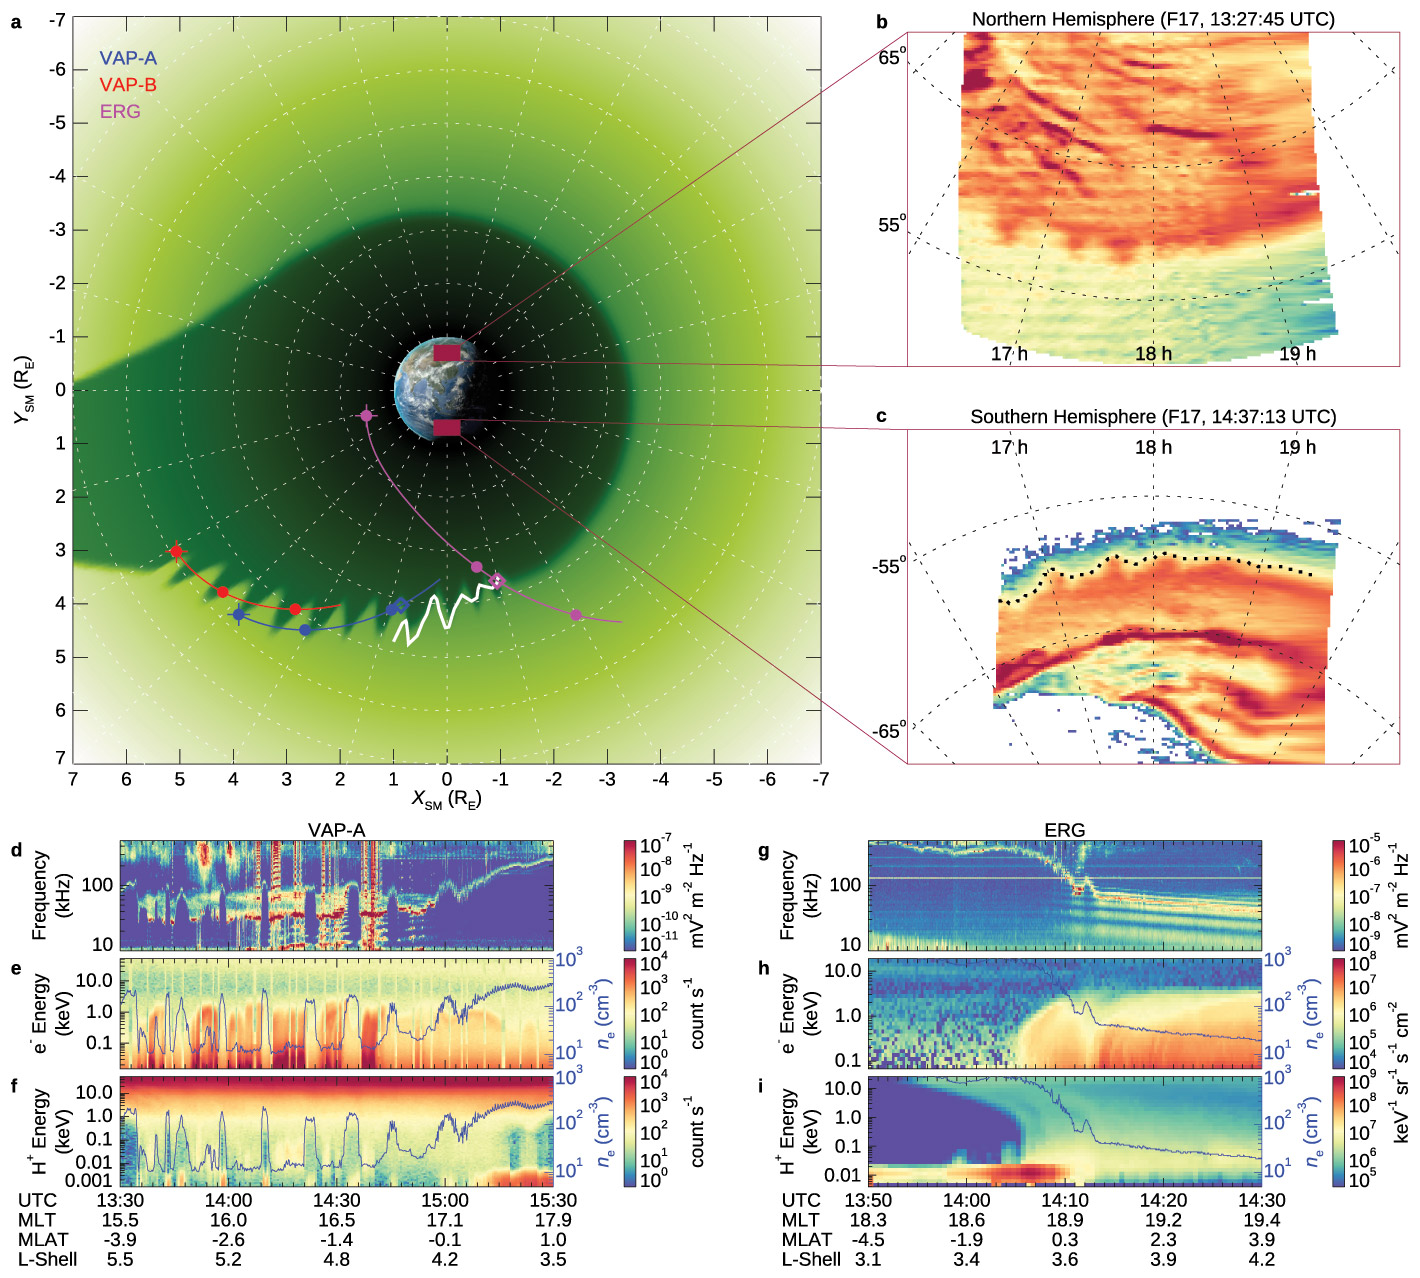
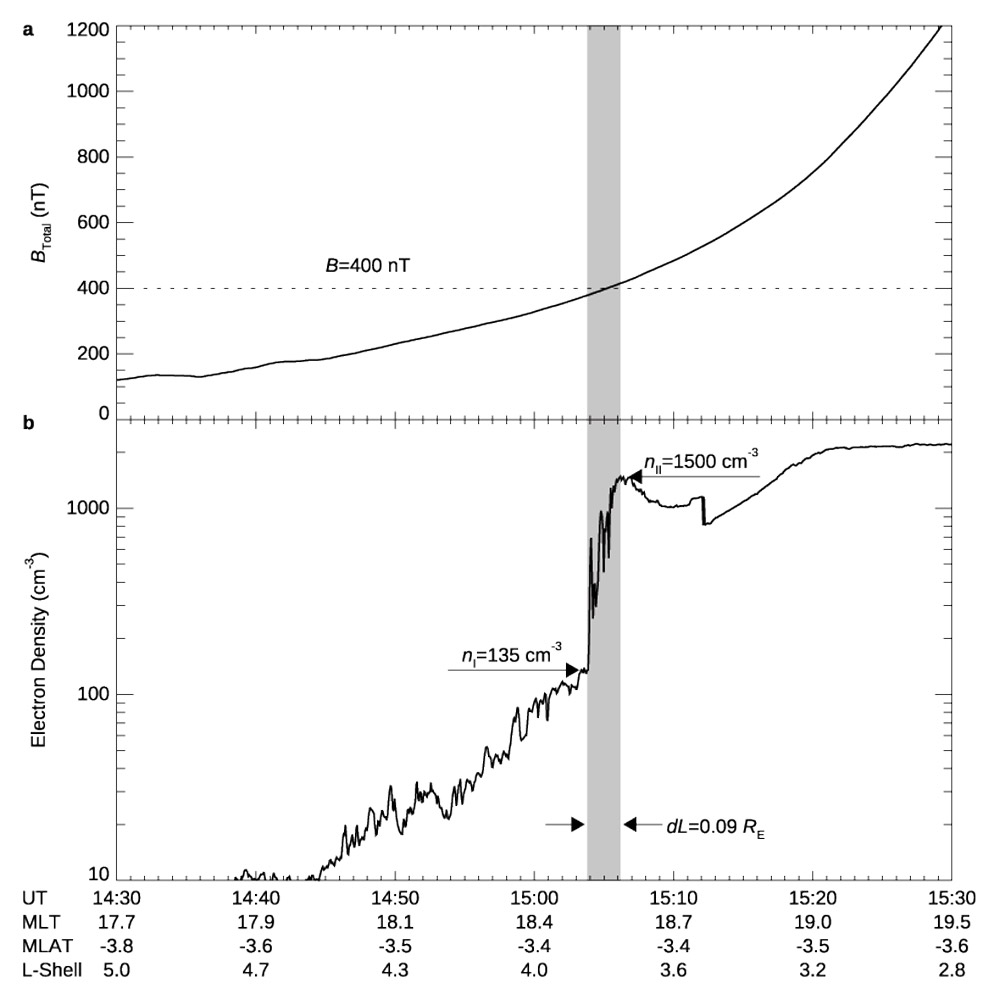
During the main phase of a geomagnetic storm on 16 July 2017, the Van Allen Probes (VAP) A spacecraft (Fig. 2d–2f) and the Exploration of energization and Radiation in Geospace (ERG, also called Arase) spacecraft (Fig. 2g-2i) alternating distributions of the cold and hot plasmas in the afternoon-to-dusk sector, revealing that these spacecraft were crossing the plasmapause several times, implying a sawtooth-shaped plasmapause undulation during this period. Evaluation of the wave activity in this region indicates that the plasmapause was modulated by the fundamental mode PSW eigenmodes at 1.5 mHz. The frequency of the PSW was confirmed by the estimation of the eigenfrequency of the plasmapause surface using the plasma density and magnetic field observed by THEMIS-E spacecraft (Figure 3).
We then compared the ground and space observations statistically for THEMIS data during 176 substorm onsets in 2009. Figure 2 shows the results of the cross-correlation between the space- and conjugate ground-based wave power. Figure 2a shows that the observations often highly correlated with Pearson coefficients over 0.8, while Figure 2b shows that while there is a broad spread, on average the space-based observations lead the ground by an average of 1 – 1.5 minutes. This confirms that the waves likely originate in near-Earth space and can be seen by spacecraft before being observed on the ground.
|
| Figure 2. Coordinated observations of PSW and associated SA on 16 July 2017. a) Schematic diagram showing the geometry of the plasmasphere (deep green area), the auroral boundary (white thick curve), and spacecraft trajectories (VAP-A, VAP-B, and ERG spacecraft shown in blue, red, and pink, respectively) on the equatorial plane in the solar magnetic (SM) coordinate system with the Sun to the left. The shape of the plasmapause is calculated from an empirical plasmaspheric model. The clear sawtooth-shaped plasmapause structure visible in the afternoon-dusk sector indicates the PSW, which is manually added based on the wavelength of the PSW calculated in the main text. The closed circles in the spacecraft trajectories indicate temporal intervals of 1 hour beginning at 13:00 UTC (indicated by the leftmost circles overlaid with crosses). Both VAP-A and VAP-B spacecraft were located in the southern hemisphere while ERG spacecraft crossed the magnetic equator at ~14:10 UTC. Open diamonds represent the plasmapause crossings by the spacecraft. Note that VAP-A and VAP-B crossed the plasmapause region roughly azimuthally while ERG crossed almost radially. b) SA observed by DMSP F17 in the Northern Hemisphere (NH) at 13:27:45 UTC. c) SA observed by DMSP F17 in the SH at 14:37:13 UTC. The dashed grid lines in b and c denote the altitude-adjusted corrected geomagnetic (AACGM) latitudes and magnetic local time (MLT). The thick dotted line in c represents the boundary of the SA, which is projected onto the SM equatorial plane using the Tsyganenko 96 magnetic field model and denoted by the white curve at the duskside plasmapause in panel a. d) Spectrogram of the electric field from the high frequency receiver of the EMFISIS instrument suite onboard VAP-A. The next two panels show the energy spectrograms of electrons e and protons f measured by the HOPE mass spectrometer onboard VAP-A, respectively. The plasmaspheric electron density (blue curve) is overlaid on panels e and f. g-i The same as those of d-f but for the ERG spacecraft. |
|
| Figure 3. THEMIS-E spacecraft observations on July 16 2017. a) Magnetic field strength measured by the Fluxgate Magnetometer. b) Electron density in the plasmasphere induced from spacecraft potential measured by the electric field instrument (EFI) and the electron thermal velocities measured by the electrostatic analyzer (ESA). The grey regions indicate the plasmapause boundary. |
Optical Manifestation of the PSWs
During this period, the Defense Meteorological Satellite Program (DMSP) F17 satellite observed sawtooth aurora (SA) at the dusk side in both hemispheres (Fig. 2b, c). The SA boundary is mapped to the sawtooth-shaped plasmapause on the equatorial plane (white line in Fig. 2a) along the modelled magnetic field lines. Using simultaneous observations from DMSP satellites, it is determined that the SA propagated sunward/westward at a phase speed of 0.01±0.001° s-1 and the azimuthal wavelength was about 6.4°–10.2° for the SA, in agreement with the PSW (~9.7°–10.5° and 0.01° s-1) obtained based on the VAP measurements, unambiguously proving that the SA was driven by the PSW; in other words, the SAs are the optical atmospheric/auroral manifestation of the PSWs.
Poleward Propagating ULF Waves
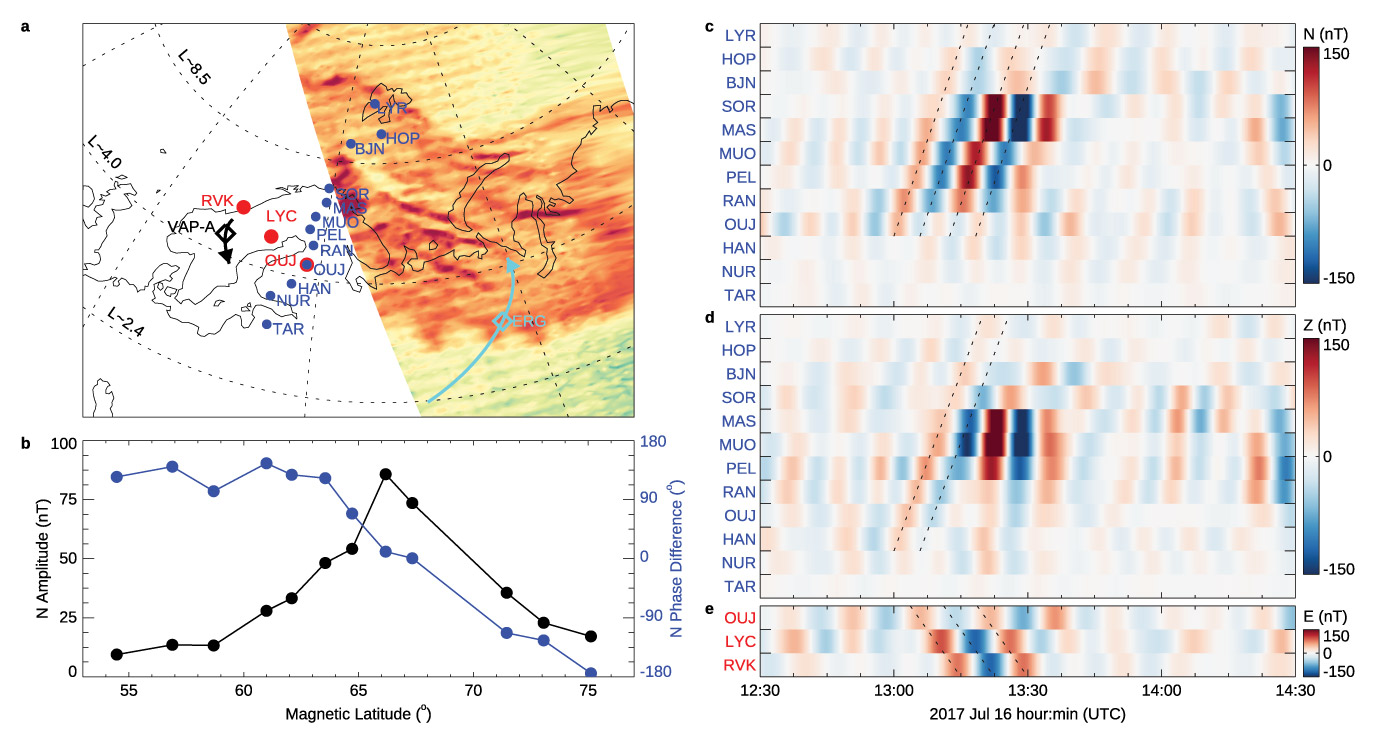
We also found that the PSW generated poleward propagating (i.e., radially outward in the magnetosphere) ULF waves. Figure 4 shows the analysis of magnetic perturbations observed by ground-based station chains from the International Monitor for Auroral Geomagnetic Effects (IMAGE) magnetometer array. The 1.4±0.5 mHz bandpass filtered N (Fig. 4c) and Z (Fig. 4d) components of the geomagnetic perturbations showed clear poleward propagation of the ULF waves starting from the OUJ station (at the AACGM latitude of 61.42° and longitude of 105.46°), which are the closest to the SA (Fig. 4c, d), i.e., the counterpart to the sawtooth-shaped plasmapause region in the magnetosphere. Such propagation is apparently contrary to the inward (or equatorward) propagation of the ULF waves generated by external sources (e.g., magnetopause or in the near-Earth magnetotail).
|
| Figure 4. ULF waves and FLR observed on the ground. a) Stations selected from the IMAGE magnetometer array with the background auroral image observed by DMSP F17 satellite at 13:27:45 UTC (see also Fig. 1b). The blue chain is aligned in almost the same magnetic longitudes of ~106±4° with the magnetic latitude increasing from 54.5° at TAR to 75.1° at LYR. The red chain is aligned in almost the same magnetic latitudes of ~61.5±0.5° with the magnetic longitude increasing from 93.3° at RVK to 106.1° at OUJ. The black/cyan arrow represents the footpoints of VAP-A/ERG satellite moving towards low/high latitudes between 13:40 UT and 15:00 UT with the diamond marking plasmapause crossing. b) Amplitude (black) and phase difference (blue) of the N component of the blue chain plotted as a function of geomagnetic latitude. c) Bandpass filtered (1.4±0.5 mHz) N component (north) of the geomagnetic field perturbations. d) Bandpass filtered (1.4±0.5 mHz) Z component (vertical) of the geomagnetic field perturbations. Clear poleward propagation of the waves is highlighted by the dashed lines. e) Bandpass filtered (1.4±0.5 mHz) E component (east) of the geomagnetic field perturbations. Clear sunward/westward propagation of the waves is highlighted by the dashed lines. |
Occurrence of the Sawtooth Aurora
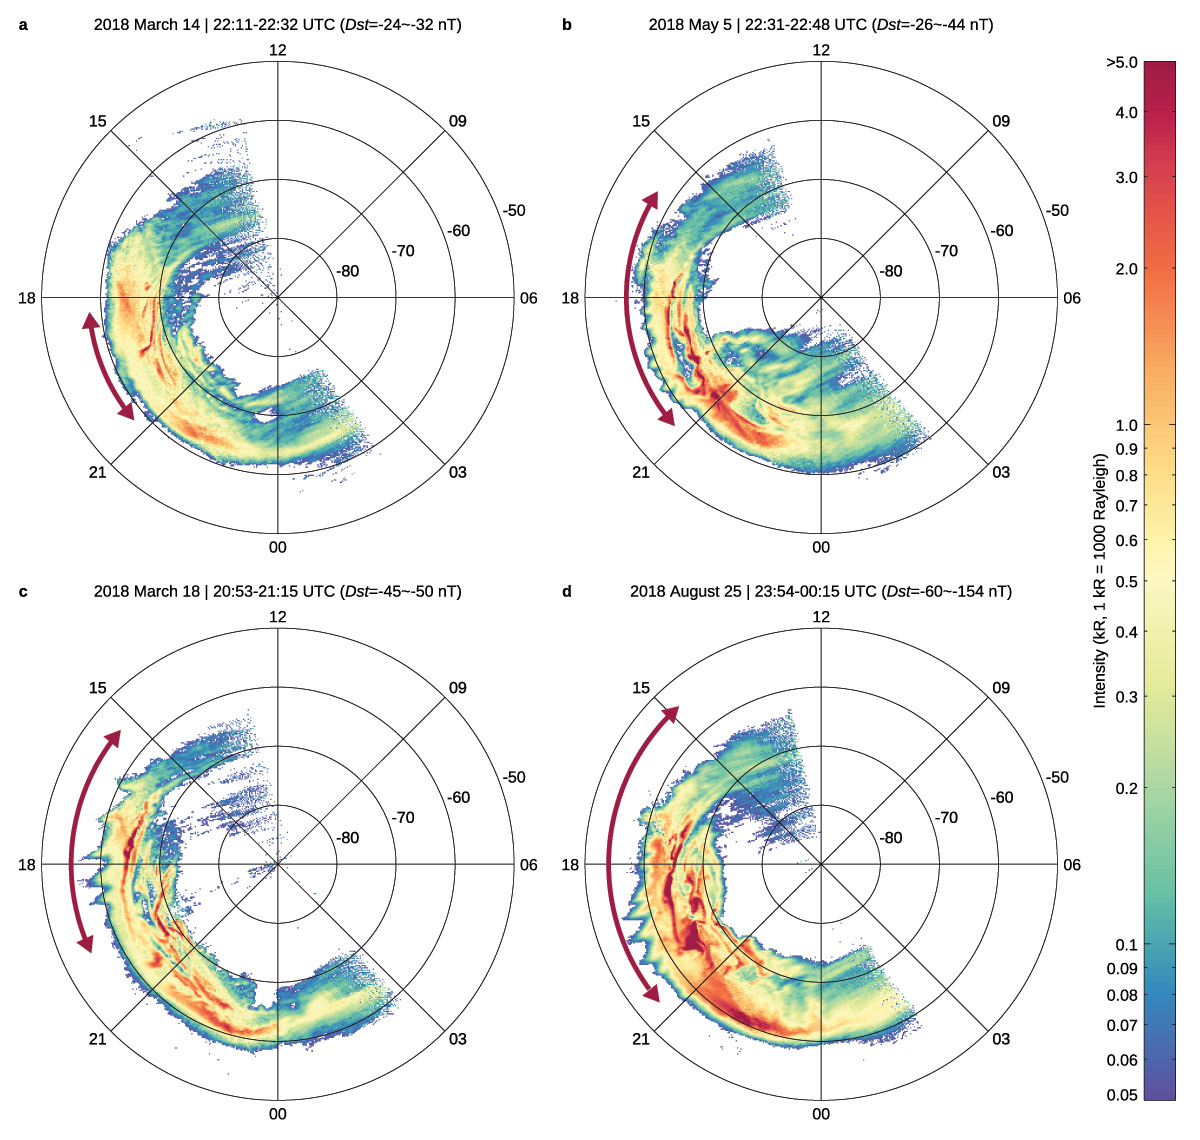
Although the PSWs can be hardly captured by in situ observations since satellites are required to cross the plasmapause region at a specific time and at a certain location, the SAs that visualize the PSW are frequently observed during geomagnetic storms. In addition to the DMSP satellites, the recently launched Chinese Fengyun-3D (FY-3D satellite in a low-Earth orbit could also well capture high-resolution global images of SAs (Fig. 5) with the on-board wide-field auroral imager (WAI). We have surveyed the aurora data recorded by both DMSP and FY-3D satellites during geomagnetic storms from 2014 to 2018. The probability of occurrence of SAs is found to be greater than 90% during geomagnetic storms. The geomagnetic pulsations occurred simultaneously with the SAs and propagated essentially radially outward when mapping to the magnetic equator and the amplitude peaked outside the plasmapause. These results definitely indicate that the PSWs, as well as the SAs, are systematic and crucial consequences of geomagnetic storms. The reconfiguration and energy redistribution processes in the magnetosphere and ionosphere associated with the PSW appear to be common and regular during the geomagnetically disturbing times, and theoretical and statistical studies are needed in the future for better understanding of the rules that govern these processes.
|
| Figure 5. SAs observed by FY-3D WAI during four geomagnetic storms in 2018. All the images observed between a) 22:11–22:32 UTC on 14 March 2018, b) 22:11–22:32 UTC on 5 May 2018, c) 20:53–21:15 UTC on 18 March 2018, and d) 23:54–00:15 UTC on 25 August 2018 are projected onto a reference sphere at a height of 110 km in the AACGM–MLT coordinate system. The SAs are highlighted by the red arrows. |
Conclusion
Our work shows direct observations of a plasmapause surface wave and its impacts during a geomagnetic storm, including sawtooth aurora and ULF waves. The generation of surface waves and ULF waves are fundamental plasma processes in space environments and can occur in other planetary magnetospheres. As is well-known in the space of giant planets, the corotation breakdown (the cause of the plasmapause in the Earth) is known to be fundamental to the dynamics of the rapid rotating planetary magnetospheres (e.g., Jupiter and Saturn). The corotation breakdown process is believed to be crucial in driving the brightest auroral emissions in our solar system at Jupiter. Therefore, the processes identified along terrestrial plasmapause boundary layer may be even more critical to the environments at rapidly rotating planets.
Reference
He, F., R.-L. Guo, W. R. Dunn, Z. Yao, H.-S. Zhang, Y.-X. Hao, Q.-Q. Shi, Z.-J. Rong, J. Liu, A.-M. Tian, X.-X. Zhang, Y. Wei, Y.-L. Zhang, Q.-G. Zong, Z.-Y. Pu, W. Wan (2020). Plasmapause surface wave oscillates the magnetosphere and diffuse aurora. Nature Communications, 11, 1668, https://doi.org/10.1038/s41467-020-15506-3.Biographical Note
Fei He is an associate professor at Key Laboratory of Earth and Planetary Physics, Institute of Geology and Geophysics, Chinese Academy of Sciences. His research focuses on characterizing global dynamics in Earth's and planetary space environments using optical imaging in combination with in-situ measurements.
 Please send comments/suggestions to
Emmanuel Masongsong / emasongsong @ igpp.ucla.edu
Please send comments/suggestions to
Emmanuel Masongsong / emasongsong @ igpp.ucla.edu