
|
|
|
by Mitsuo Oka
In the magnetotail, an "X-line" is where magnetic field lines reconnect and release the energy in an explosive manner. The X-line has previously been detected and studied when it retreats tailward and passes by the spacecraft. But why does it move tailward in the first place? This article presents a multi-probe observation of the entire magnetotail to understand a possible relationship between the X-line retreat motion and the dipolarization of the Earth's magnetosphere.
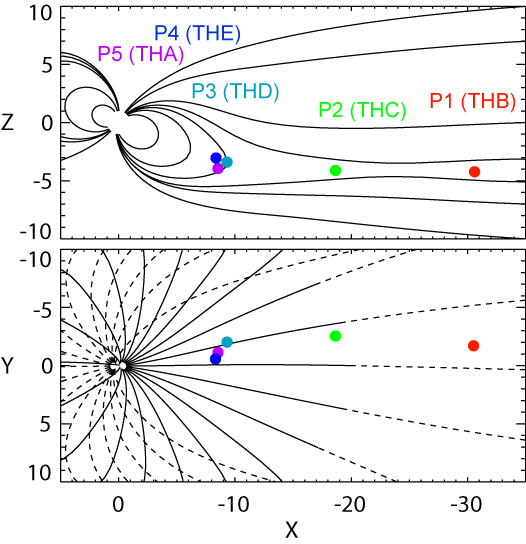
Figure 1 shows the locations of all five THEMIS probes at 04:06 UT on 7 February 2009. It is evident that the probes were located in the midnight sector but were roughly aligned in the x-direction over more than 30 RE, allowing us to study the large-scale evolution of the magnetotail.
|
| Figure 1. Locations of the THEMIS probes at 04:06 UT on 7 February 2009. Also shown is the T-96 model of the magnetic field lines |
|
Click each image to enlarge. |
Event Overview
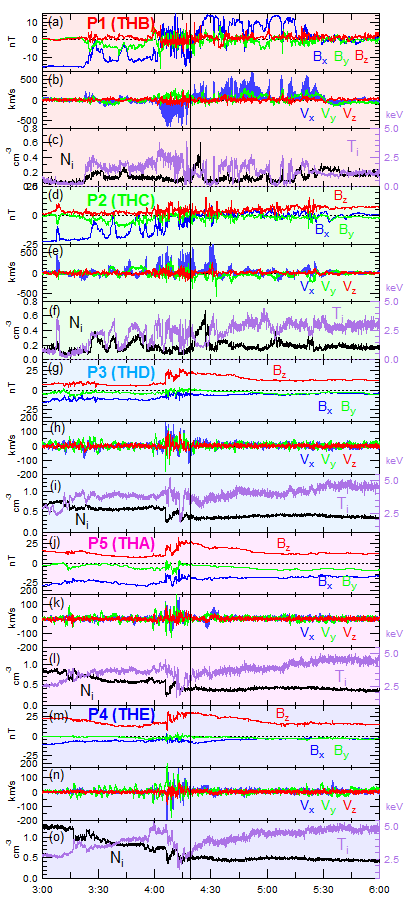
Figure 2(a-f) show evidence of magnetic reconnection and the retreat motion of the X-line. Tailward fast flows were seen from ~04:00 UT at P1 and P2, but the tailward flows at P1 turned into earthward flows at around 04:18 UT as marked by the vertical line. The magnetic field Bz also turned from negative to positive around this time. These signatures indicate that the X-line moved tailward and passed by P1 at around ~04:18 UT.
Figure 2(g-o) show evidence of the dipolarization of the inner magnetosphere. Magnetic field (Bz) enhancements were seen from ~04:06 UT at P3, P5 and P4, but after its peak at ~04:18 UT, the Bz magnitude started to decrease gradually, indicating that the inner magnetosphere began to become tail-like.
Here, we would like to emphasize the clear, temporal coincidence (at ~04:18 UT) between the flow reversal (observed at P1) and the beginning of the re-configuration of the inner magnetosphere (observed at P3, P4 and P5). Is there any connection between the two features?
|
| Figure 2. An overview of the X-line retreat event on 7 February 2009. The magnetic fields, the flow speeds and the higher moments (ion density and ion temperature) are shown for the five probes in order of decreasing distance to the Earth. |
|
Click each image to enlarge. |
Analysis
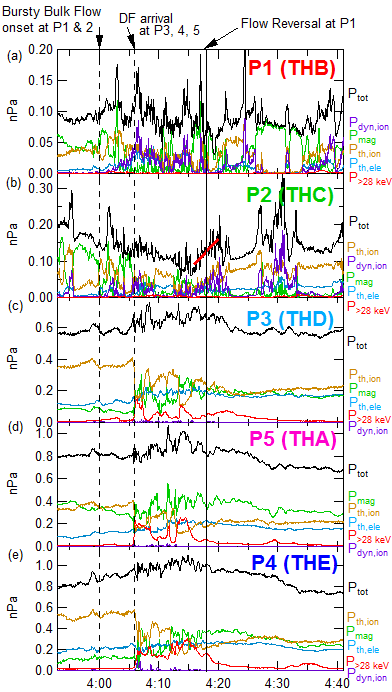
To look for a clue, we studied the pressure variations with particular emphasis on the intermediate location P2 and found that the total pressure was increasing at P2. Figure 3b indicates that the total pressure Ptot (black curve) was decreasing (from ~0.2 nPa) and reached its minimum (~0.06 nPa) at 04:16 UT. Then, it rapidly recovered up to ~0.15 nPa within a few minutes (highlighted by the superposed red line) during which the flow reversal was detected at P1. At the inner probes (Figure 3(c-e)), the total pressure showed a slight enhancement during dipolarization. At the outer probe P1 (Figure 3a), the total pressure did not show any systematic increase or decrease despite the short time-scale spikes.
|
| Figure 3. Pressure variations during the X-line retreat event on 7 February 2009. In each panel are the dynamic pressure of ions Pdyn,ion = NimiVi², the magnetic pressure Pmag = B²/2m0, the ion thermal pressure Pth,ion = NiTi, the electron thermal pressure Pth,ele = NeTe, and the energetic ion pressure P>28keV and their total Ptot. Note P>28keV covers the SST ion energy range of >28 keV. Here, the energetic electron data are not used because its contribution to the pressure was negligible. |
|
Click each image to enlarge. |
Discussion and Conclusion
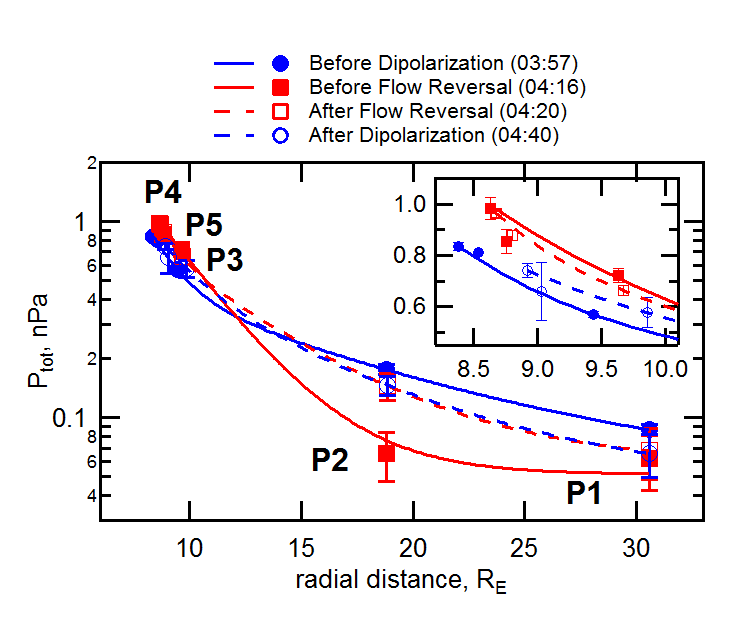
To further discuss the meaning of the observed pressure variations, Figure 4 takes the data from four different times in Figure 3 and re-organizes them as a function of radial distance r. It is evident that, in general, Ptot decreases considerably with an increasing distance from the Earth. However, the pressure gradient between P1 and P2 was increasing during 04:16-04:20 UT. Note again that the earthward and tailward flows were observed by P1 and P2, respectively, before the X-line passage, indicating that the X-line was initially positioned between P1 and P2. We therefore conjecture that the large-scale, pressure-gradient-force associated with the reconfiguration of the dipolarized magnetosphere led to the retreat motion of the X-line. Based on the momentum equation of the magnetohydro-dynamics (MHD), we estimated an upper limit of the retreat speed as VXL< 680 km/s.
|
| Figure 4. Large scale pressure variation during the X-line retreat event of 7 February 2009. The total pressure Ptot is plotted as function of radial distance r, obtained at four different times. The inset is a blow-up around the inner probes. The error bars are the standard deviation within ± 1.5 minute of each time. The curves represent the best fit model by a double exponential function. |
|
Click each image to enlarge. |
Source
Biographical Note
Mitsuo Oka is an Assistant Research Physicist at Space Sciences Lab, UC Berkeley. His research interests include particle acceleration by magnetic reconnection and shocks.
 Please send comments/suggestions to
Emmanuel Masongsong / emasongsong@igpp.ucla.edu
Please send comments/suggestions to
Emmanuel Masongsong / emasongsong@igpp.ucla.edu