

2022 THEMIS SCIENCE NUGGETS
Magnetosphere-Ionosphere Coupling Between North-South Propagating Streamers and High-Speed Earthward Flows
J.M. Weygand
Institute of Geophysics and Planetary Physics, University of California Los Angeles, Los Angeles, CA, USA
Introduction
North-south auroral streamer studies have demonstrated that the streamer ionospheric current pattern matches the expected field-aligned currents in the magnetotail. However, few studies have examined the development and dynamics of the coupled magnetosphere-ionosphere streamer current system. Early studies hypothesized that the fast flows in the plasma sheet produced field aligned currents in the tail that mapped to the north-south streamer with a similar wedge-like configuration as the substorm current wedge. They showed that downward field aligned currents intersected the ionosphere on the dawnside of the arc along with an upward current located on the duskside of the north-south arc [Kauristie et al., 1996; 2000]. In particular, two case studies have validated the above hypothesis that fast flows and field aligned current generation are consistent with observations of equivalent ionospheric current patterns derived from ground magnetometer data [Nakamura et al., 1993; Amm et al., 1999]. In our study we not only demonstrate that the magnetosphere-ionosphere streamer current system is consistent with the Kauristie et al., [1996] model but we also show the development of the current system and determine if the upward current leg equals in magnitude the downward current portion.
Results
|
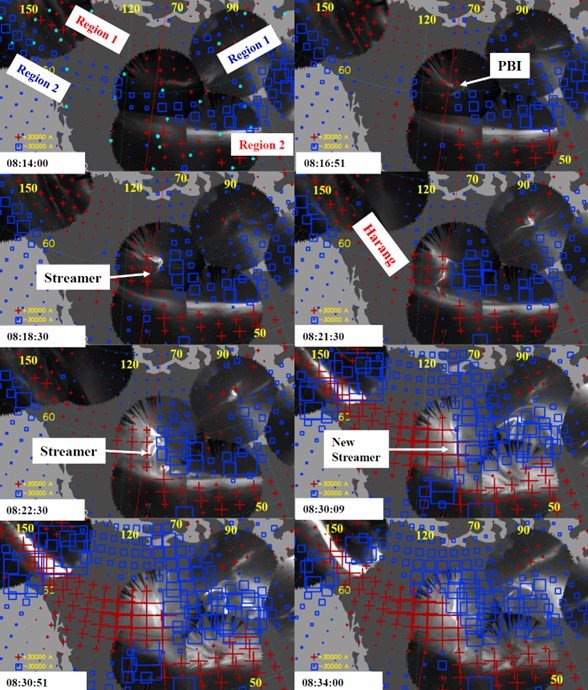
| Figure 1. Sequence of auroral all-sky mosaics from 08:14 UT to 08:34 UT with the SEC amplitudes plotted over the auroral images. The red vertical line indicates local midnight, and the coordinate system shown is a geographic coordinate system. The blue squares indicate downward currents, and the red + symbols show upward currents. The key for the currents is in the lower left of each panel. |
Figure 2 displays a sequence of all sky image (ASI) mosaics of a couple of north-south streamers observed on 29 February 2008 over Canada with the spherical elementary current (SEC) amplitudes (proxy for the field aligned currents) overlain on auroral images. The event occurs during a geomagnetically active period where the world data center (WDC) AL index is between -200 nT and -800 nT. A substorm expansion phase begins at about 08:22 UT. In Figure 1, good auroral images were available from ASIs at GAKO, INUV FSMI, ATHAT, TPAS, RANK, and SNKQ. The auroral images from the other relevant stations showed only clouds and hence were not useful for this study. A geographic coordinate system is shown, and the red vertical line in the center of the image marks local midnight. The blue squares represent downward SEC amplitudes into the ionosphere, and the red + symbols indicate upward current out of the ionosphere. The ASI mosaic at 08:14:00 UT shows both poleward and equatorward auroral arcs (i.e., double auroral oval) at about 62° and 55° geographic latitude (GLat), respectively, and a band of blue downward current between the two auroral arcs crossed from western Alaska to Hudson Bay. In just the first ASI mosaic at 08:14:00 UT we show the magnetometer positions for magnetometers with available and valid data marked with the white asterisks. At 08:16:51 UT at local midnight, a poleward boundary intensification (PBI) begins, and the band of downward current is bifurcated. At about 08:18:30 UT, a streamer begins to stretch equatorward from the poleward boundary of the auroral oval, and the current amplitudes to the east and west begin to intensify. By 08:21:30 UT, the north-south streamer has reached the equatorward auroral arc, and the current amplitudes continue to increase in magnitude. The Harang current system is clear at this time and has been identified as a region of upward current that transitions from region 1 upward current over Alaska and Western Canada to region 2 upward current over south central Canada. This region also corresponds to shearing between the eastward and westward electrojets that will be shown below. At 08:22:30 UT, the streamer sharply increases in intensity and possibly another streamer forms. The current amplitudes still appear to increase in magnitude. At about 08:30:09 UT, another north-south streamer forms, and the current amplitudes appear to reach a maximum. From 08:30:51 UT to 08:34:00 UT, the auroral emissions and current begin to gradually decrease in magnitude.
|
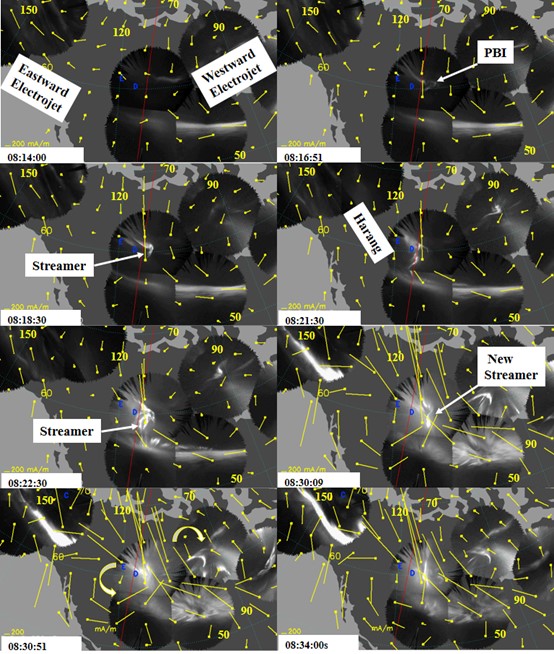
| Figure 2. Sequence of auroral all-sky mosaics from 08:14 UT to 08:34 UT with the equivalent ionospheric currents plotted over the auroral images. The footpoints of the THEMIS E and D spacecraft are shown just to the left of the north-south streamer at about local midnight. This figure is the same set of auroral mosaics with a similar format. The key for the currents is in the lower left of each panel. |
Figure 2 shows the same set of auroral mosaics, but now with the equivalent (horizontal) ionospheric currents overlain on the mosaics. Also displayed are the footpoints of the THEMIS D and E spacecraft (in blue) just to the left of the north-south streamer. The THEMIS spacecraft were mapped from the magnetotail to the ionosphere using a magnetic field line model with the appropriate solar wind and geomagnetic conditions. At 08:14:00 UT and 08:16:51 UT, the equivalent currents at about local midnight point toward the polar cap, which indicates anti-sunward (i.e., equatorward) ionospheric flow. From 08:16:51 UT to the end of the sequence, the equivalent ionospheric current at the location of the streamer points poleward, which further indicates earthward flow within the magnetotail. At 08:18:30 UT, these currents begin to significantly enhance at the location of the PBI and the streamer. At 08:21:30 UT, a counter-clockwise vortex is apparent in the equivalent currents to the west southwest of the spacecraft foot point and streamer. A counter-clockwise vortex indicates a strong upward current, as shown in Figure 1. At 08:30:09 UT, the current dramatically increases in magnitude with the formation of a new streamer. A counter-clockwise vortex is visible to the west of the streamer, and a clockwise vortex is present to the east of the streamer. The curl of these vortices are shown with arrows in 08:30:51 UT panel. The clockwise vortex indicates a strong downward current, as shown in Figure 1. Throughout 08:30:51 UT, the equivalent currents remain strong but begin to decrease in magnitude at around 08:34:00 UT.
|
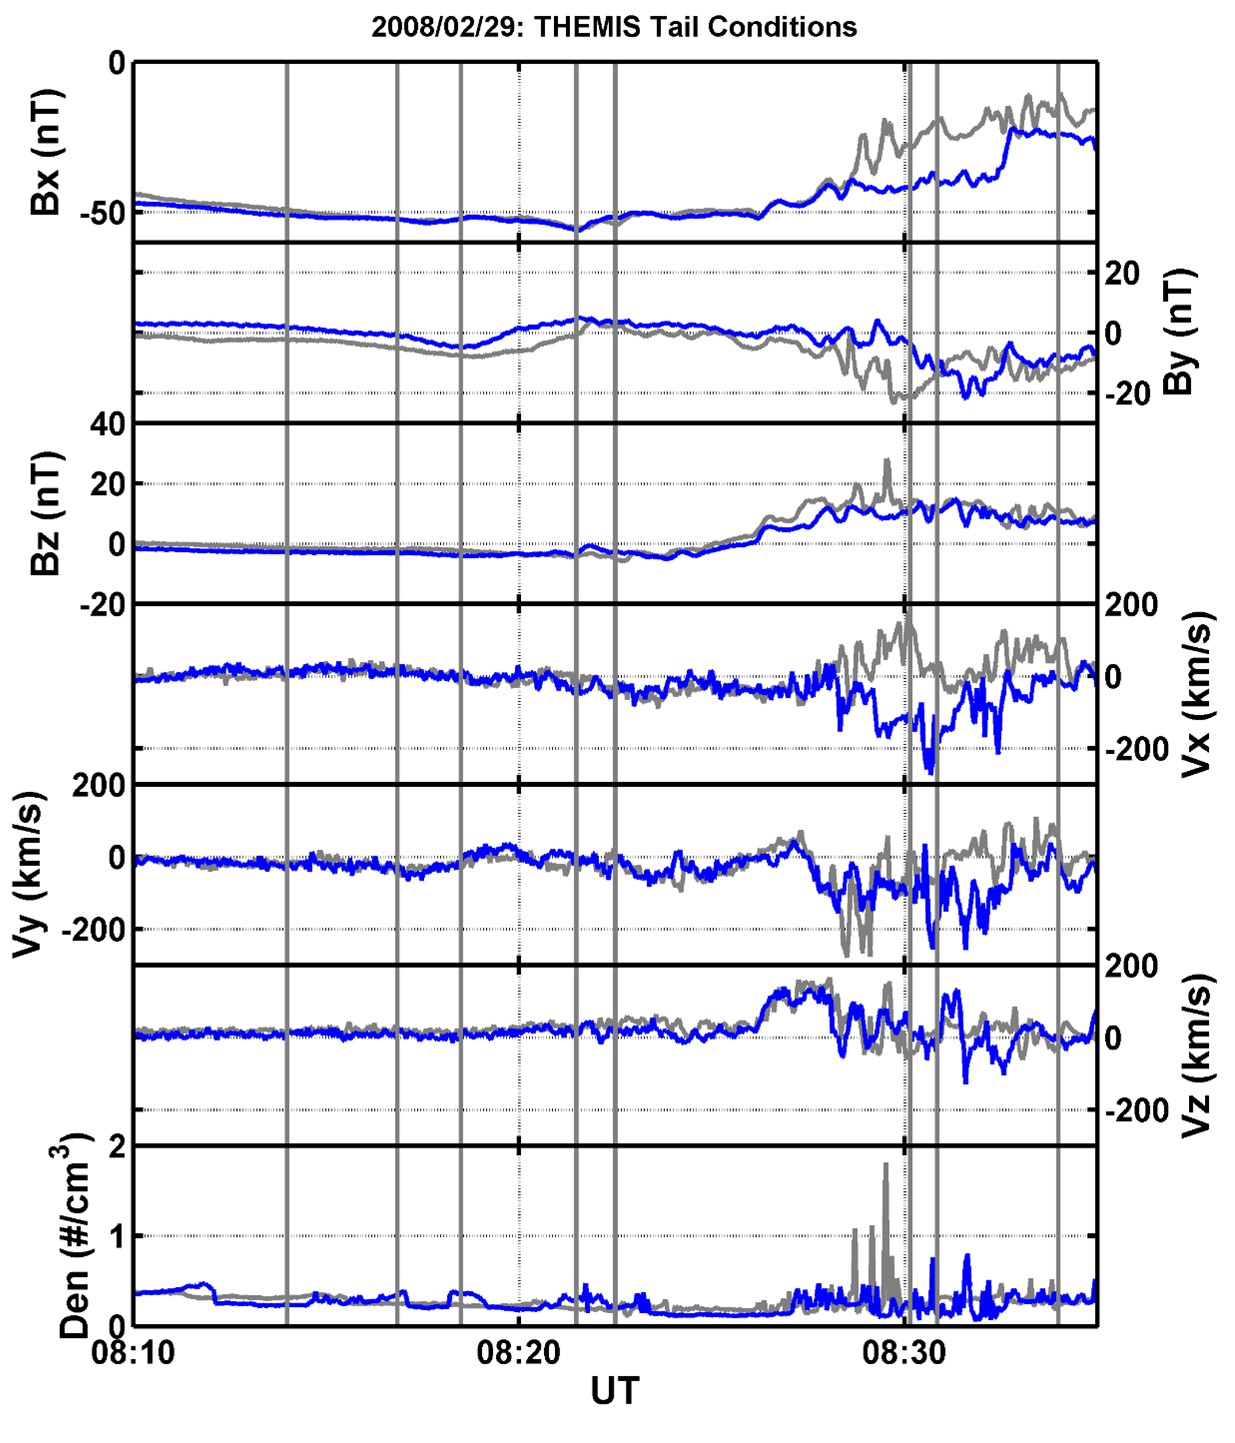
| Figure 3. THEMIS D (gray) and E (blue) magnetic field data (top 3 panels), velocity component data in the next three panels, and the density in the bottom panel. The magnetic field and flow are in GSM coordinates. The vertical gray lines mark the times of the mosaics in Figure 2. |
Figure 3 displays magnetic field and plasma data from the THEMIS D (THD) and E (THE) spacecraft that are located in the tail. The footpoints of the THD and THE are approximately conjugate to the later streamer visible at 08:30:09 UT in Figure 2 based on the magnetic field line mapping. The magnetic field is given in the top three panels. The first panel (Bx component) indicates that the spacecraft are in the southern lobe until at least 08:29:00 UT for THD. The third panel, Bz, shows the dipolarization of the tail at about 08:25:00 UT. Based on the Bx and density data, we believe THD is most likely located in the plasma sheet boundary layer after 08:29:00 UT. Along with that dipolarization are high-speed earthward flows of about 180 km/s at THD at 08:30:00 UT, which are most likely associated with the streamer at 08:30:09 UT in Figures 1 and 2. It is worth noting that THD and THE are about the same distance downtail (~11 Re), but azimuthally separated by only 1 Re and both spacecraft record negative Vy flows, yet Vx still points in the opposite directions at THE compared to THD. We interpret the Vx and Vy data to indicate that THE may be located in a duskside convection cell.
|
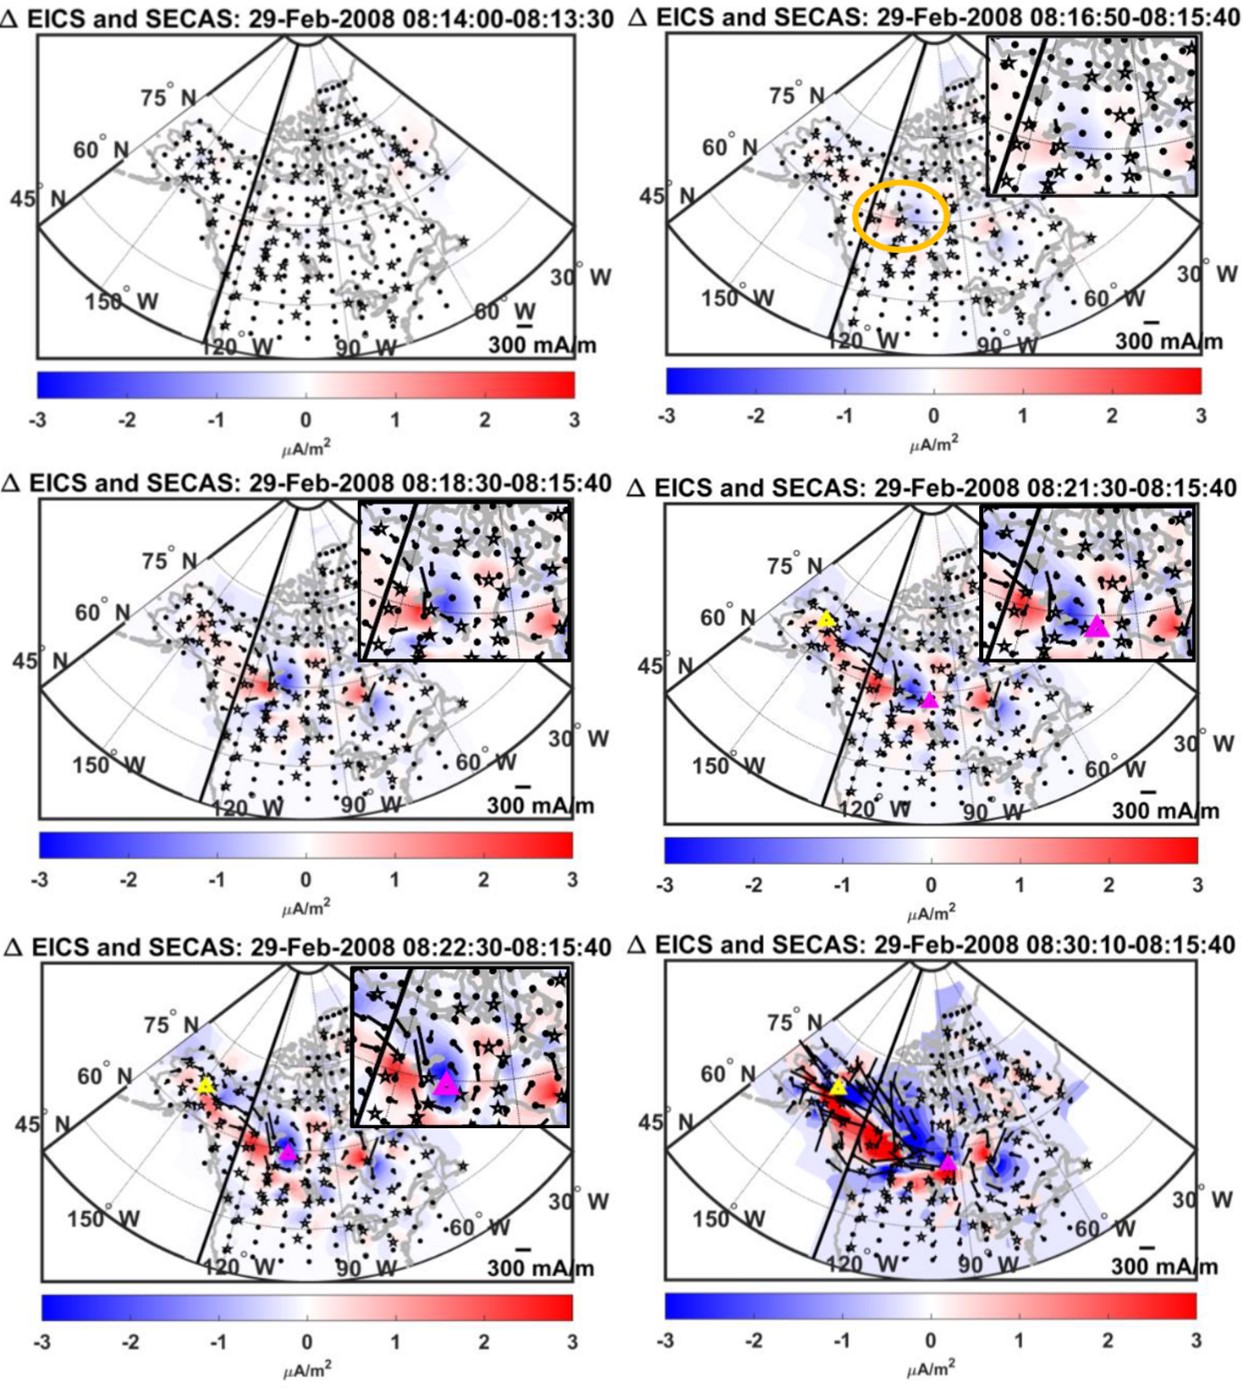
| Figure 4. Differenced SEC maps. Each panel shows the combined field-aligned like current densities and equivalent currents. In each panel, a background set of currents has been subtracted off, and the time of the background currents is given in the title of each panel. The vertical bar marks local midnight, the key for the equivalent current is given in the lower right corner, and the color bar indicates the current density values. The orange oval in the upper right panel shows the start of the current wedge associated with the north-south streamer. The mauve and yellow symbols indicate the downward and upward portions of the substorm current wedge. |
Figures 1 and 2 show the combination of the region-1 and region-2 current systems as well as the equivalent currents associated with the north-south streamer. To more clearly show the current wedge system specifically associated with the streamer, we subtract off a “background” Birkeland current system at specific times. Figure 4 displays the combined equivalent ionospheric currents and the current density derived from the current amplitudes minus the “background” region-1 and region-2 current system. The current amplitudes are converted into current densities by dividing the current by the rectangular area around the position of the current amplitude. In each panel, the currents are plotted across North America and Greenland on a geographic coordinate system. The dots in the panels indicate the position at which the equivalent current has been derived and the key is in the lower right corner. The vertical black bar marks local midnight, and the color bar for the current density is given at the bottom of the panel. The title over each panel provides the time of the SECs and the time of the background SECs that were removed. At 08:14:00 UT there is essentially no current visible because the streamer has not yet begun to form, and the region-1 and region-2 currents between 08:14:00 UT and 08:13:30 UT have changed very little. At about 08:16:50 UT, the north-south streamer has begun to form and within the orange oval, the pair of downward and upward currents associated with the current wedge are now becoming visible. Between the downward and upward currents is a poleward pointing equivalent current similar to the current at 08:16:51 UT in Figure 2. To better display the north-south streamer current system, an expanded region of the streamer currents is shown in the upper right corner for times 08:16:51 UT to 08:22:30 UT. Also at 08:16:51 UT at another streamer current wedge associated with an auroral streamer begins to form at about 57° geographic latitude and 80° west geographic longitude on the eastern side of Hudson Bay over Sanikiluaq. At 08:18:30 UT, the current wedge associated with the streamer is readily apparent, and both the vertical current and the equivalent ionospheric currents have increased in magnitude. There is now a clear counter-clockwise vortex in the equivalent current around the upward current region and a clockwise vortex around the downward current area.
|
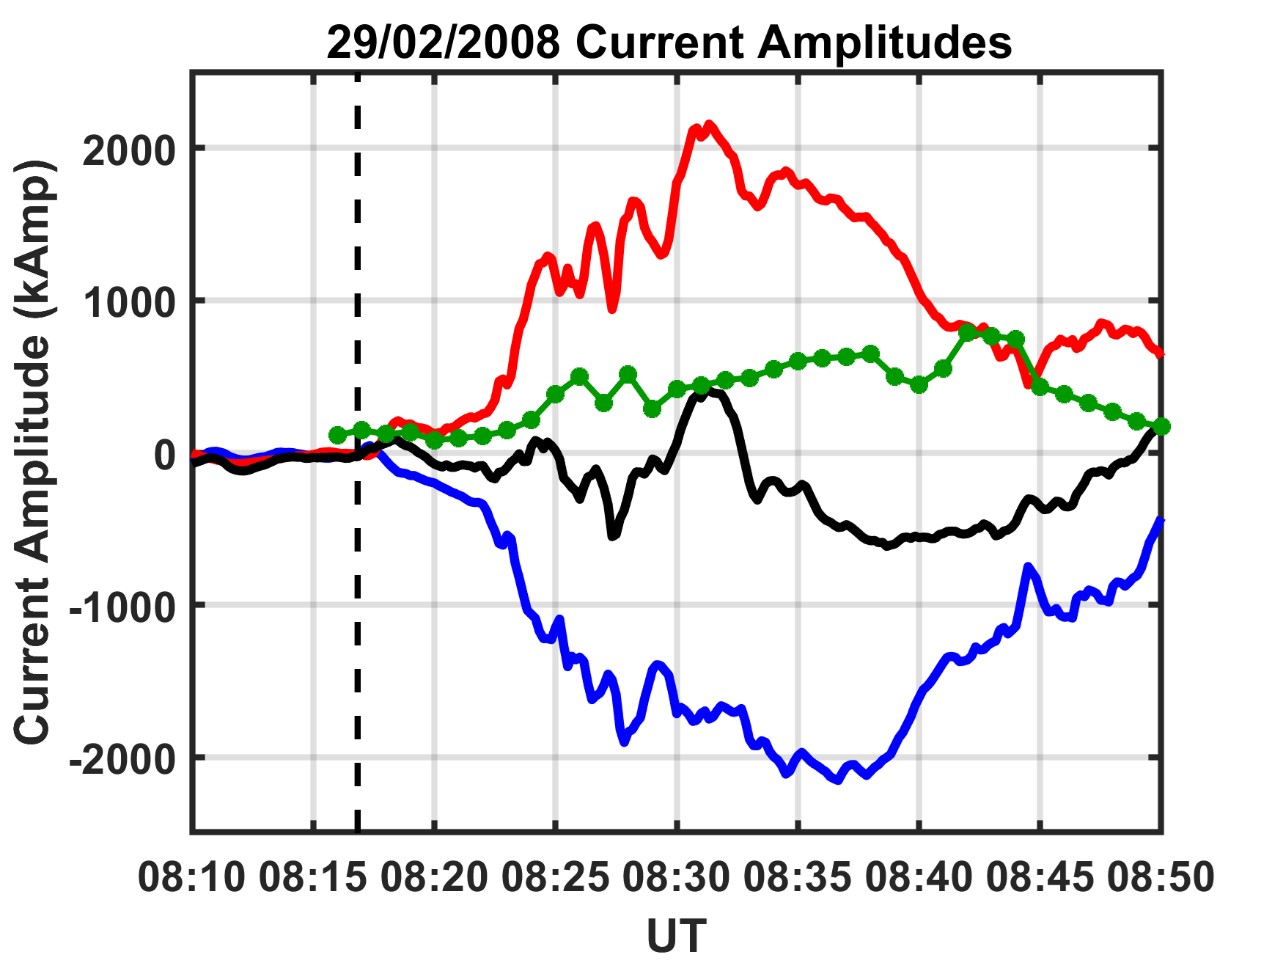
| Figure 5. Upward and downward current minus the background Birkeland current system from the 29 February 2008 streamer current system. The red curve is the upward currents, the blue curve is the downward currents, and the black curve is the difference between the two. The green curve displays the substorm current wedge value determined by the Chu et al. [2014] technique. The vertical black dashed line marks the start of the auroral streamer. |
Figure 5 shows a times series of the upward and downward currents within the streamer current wedge with the background current. The red curve is the sum of the upward current in that region, the blue curve is the sum of the downward current, and the black curve is the difference between the two. For about the first 10 minutes from 08:16:00 to 08:26:00 UT during the first few streamers the the upward and downward currents within the streamer current wedge are approximately equal in magnitude. However, as the substorm progresses and a streamer appears just before 08:30:00 UT, the currents do not stay in balance. It is unclear why the upward anf downward FACs do not remain in balance, but is most likely due to the complex current system associated with the substorm. As the substorm currents enhance the currents within the region become quite complex and it is difficult to separate the currents associated with just the steamer and the substorm. Figure 4 demonstrates in the last two panels how the current system in the region changes from a simple streamer like current wedge at 08:22:30 UT to something more complex where it becomes difficult to clearly identify the streamer current wedge from the substorm westward surge. Also plotted within Figure 5 is the value of the current fit to the substorm current wedge (green curve) as derived by the substorm current wedge inversion technique. For the first several minutes of the streamer and substorm event, the substorm current is larger than or equal to the streamer current. After 08:20:00 UT, the value of the current in the streamer is significantly larger than the substorm current wedge at most by about a factor of 4 at 08:31:00 UT.
Conclusion
In this study, we have examined two north-south oriented streamer events in detail using both ground-based and space-based platforms and compared the streamer current systems with the larger substorm current system identified using the SCW inversion technique. We summarize the main results of the study here.
1) In one event, we observe all the features associated with streamers/high speed earthward flows [Kauristie et al., 1996, 2000] including: earthward fast flows observed by spacecraft, auroral streamers, downward field aligned current on dawn side and upward field aligned current on duskside, poleward pointing horizontal currents in the streamer, and appropriate current vortices.
2) The subtraction of the region 1 and region 2 current systems clearly show a pair of streamer-related field-aligned-like currents throughout the lifetime of the streamer.
3) Streamer current wedge does not widen in MLT with time, whereas the substorm current wedge does widen in MLT, by tens of degrees.
4) The streamer field-aligned-like currents are more transient and localized than a substorm current wedge, while their amplitude is larger than the substorm current wedge for the events examined here.
5) The field-aligned like current is roughly conserved between the downward and upward current segments in the first streamer on 29 February 2008.
Reference
Amm, O., A. Pajunpää, U. Brandström (1999), Spatial distribution of conductances and currents associated with a north-south auroral form during a multi-substorm period, Ann. Geophys., 17, 1385-1396.Kauristie, K., V. A. Sergeev, T. I. Pulkkinen, R.J. Pellinen, V. Angelopoulos, and W. Baumjohann (1996), Study on the ionospheric signatures of the plasma sheet bubbles, International Conference on Substorms, 389, 93.
Kauristie, K., V. A. Sergeev, M. Kubyshkina, T. I. Pulkkinen, V. Angelopoulos, T. Phan, R. P. Lin, and J. A. Slavin (2000), Ionospheric current signatures of transient plasma sheet flows, J. Geophys. Res., 105, 10,677-10,690.
Nakamura, R., T. Oguti, T. Yamamoto, and S. Kokubun (1993), Equatorward and Poleward Expansion of the Auroras During Auroral Substorms, J. Geophys. Res., 98, 5743–5759, doi:10.1029/92JA02230.
Weygand, J. M., Bortnik, J., Chu, X., Cao, X., Li, J., Aryan, H., and Tian, S. (2022). Magnetosphere-ionosphere coupling between north-south propagating streamers and high-speed earthward flows. Journal of Geophysical Research: Space Physics, 127, e2022JA030741. https://doi.org/10.1029/2022JA030741.
Biographical Note
James is reseacrher at the University of Californa, Los Angeles. He received a Bachelor's in Math and Physics from St. Olaf College and Master’s and PhD in Space Phsyics from the University of Calgary. His current research focuses on understanding magnetosphere-ionosphere coupling, through analysis of ground magnetometer and spacecraft measurements.
 Please send comments/suggestions to
Emmanuel Masongsong / emasongsong @ igpp.ucla.edu
Please send comments/suggestions to
Emmanuel Masongsong / emasongsong @ igpp.ucla.edu