

2025 THEMIS SCIENCE NUGGETS
Streamer-like red line diffuse auroras driven by time domain structures associated with electron injection and braking ion flows
Yangyang Shen
Department of Earth, Planetary, and Space Sciences, University of California, Los Angeles
Introduction
Auroral streamers are important meso‐scale processes that transport plasma and magnetic energy and drive dynamic magnetosphere‐ionosphere (MI) coupling and space weather. Auroral streamers are commonly known as the ionospheric manifestation of plasma sheet ion burst bulk flow (BBF) channels. Prior studies have identified two distinct types of precipitation patterns associated with streamers. Type‐I streamers exhibited monoenergetic electron precipitation from field‐aligned acceleration, coinciding with narrow upward FAC regions. In contrast, Type‐II streamers, often seen more equatorward and closer to diffuse auroral regions, displayed precipitation characteristics almost the same as diffuse auroras, with no evidence of field‐aligned acceleration. Indeed, the rapid plasma transport associated with BBFs toward Earth generates plasma waves that can scatter electrons, leading to electron loss into the ionosphere and the atmosphere via collisions with neutrals. It remains unclear what magnetospheric conditions or ionospheric conditions determine the occurrence of the two types of streamers. Although streamers are typically studied using imagers sensitive to energetic (>1 keV) electron precipitation, such as all‐sky imagers, some are associated with low‐energy (<1 keV) precipitation better captured by red‐line auroral emissions. Here using conjugate measurements between the THEMIS spacecraft and ground‐based whitelight all‐sky imager (ASI), the Redline Emission Geospace Observatory (REGO) 2D red‐line imager, and a multi‐wavelength MSP, all located at Fort Smith, we establish the first direct linkage between streamer‐like red‐line auroras and electron precipitation induced by time domain structures (TDSs), appearing as broadband electrostatic fluctuations in the frequency domain, associated with a plasma sheet electron injection and braking ion flows.
Results
|
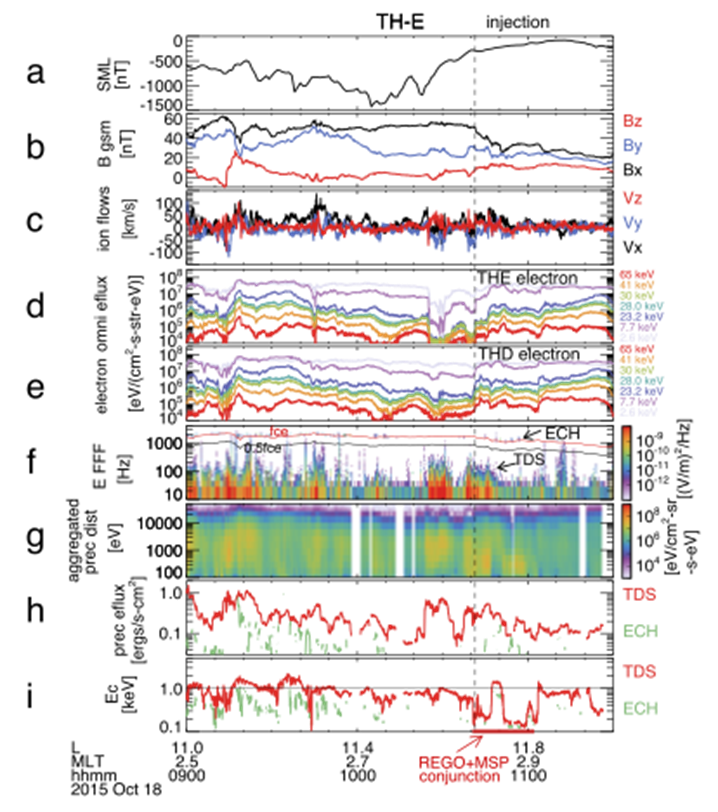
| Figure 1. (a) SML index. (b) THEMIS-E magnetic field. (c) Ion flow velocity. (d-e) THEMIS‐E and THEMIS‐D electron energy flux in 2.6–65 keV. (f) Wave electric field spectra. (g) Aggregated precipitating electron distributions due to combined TDS and ECH scattering effects. (h) Integral precipitating electron energy fluxes due to individual wave effects. (i) Precipitation electron characteristic energy E_c. |
This is a substorm‐like event that occurred between ~07:00–11:30 UT on 18 October 2015, during a moderate geomagnetic storm as Dst descended to − 56 nT. During the recovery phase near 10:40 UT, the THEMIS‐E spacecraft, positioned in the tail‐to‐dipole transition region with L ∼ 11.8 and MLT ∼ 2.9 hr, observed an electron injection with energy flux enhancements across a broad range of energies up to ∼200 keV, along with weak but noticeable earthward ion flows with Vx exceeding 80 km/s (Figures 1b–1e). Figure 1f shows that broadband electrostatic fluctuations persisted below ∼1 kHz, electron cyclotron harmonic (ECH) waves above fce were intermittent around the injection, and no whistler‐mode waves were detected throughout the event. Although high‐cadence waveform data were unavailable during 10:00–11:30 UT, those available around the injection event near 09:00‐09:20 UT revealed that these electrostatic broadband fluctuations consisted of TDSs at frequencies above ∼50 Hz. Using in‐situ plasma and field measurements, we calculate the bounce‐averaged diffusion coefficients Dαα for TDSs and ECH waves (Shen et al., 2024). These time‐varying Dαα, combined with measured equatorial electron energy fluxes near the loss cone, are used to estimate the aggregate and constituent precipitating electron distributions within the loss cone resulting from electron scattering by combined and individual wave effects (Figures 1g and 1h). Precipitating fluxes driven by TDS activities persisted throughout the event and were generally stronger than those driven by ECH waves, which were more intermittent and bursty and exhibited weaker amplitudes.
|
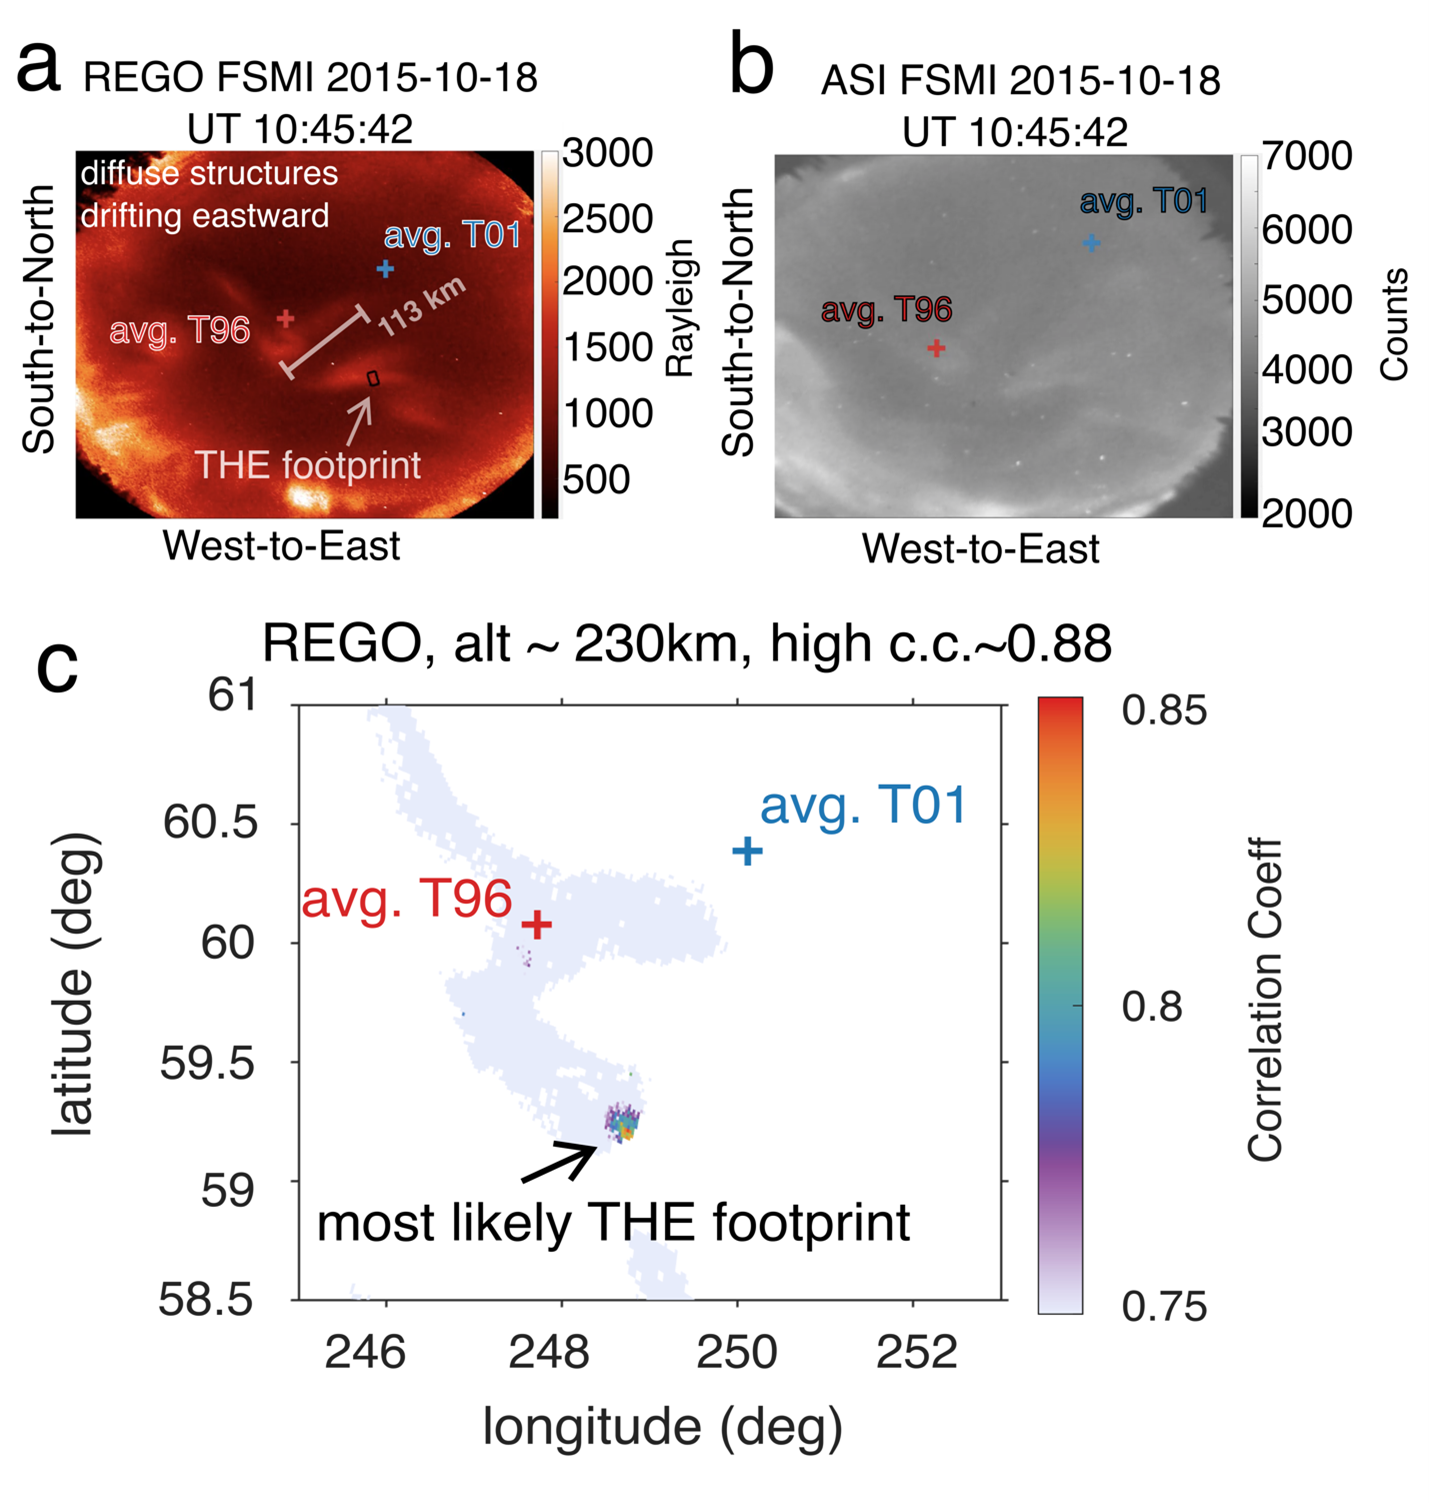
| Figure 2. (a) Example REGO red‐line auroral image showing streamer‐like diffuse auroral structures with horizontal spatial scales of up to ∼100 km drifting eastward and equatorward, recorded at 10:45:42 UT. (b) Example ASI whitelight auroral image corresponding to the red‐line image. The streamer‐like structures are less clear, blended into the diffuse auroral background. (c) Cross‐correlation coefficients between red‐line auroral intensities measured by the REGO 2D imager and TDS‐ driven precipitating electron energy fluxes estimated from THEMIS‐E. The maximum correlation reached ∼0.88 around the geographic latitude of 59.1° and longitude of 248.9°, which we interpret as the most likely THEMIS‐E footprint during the 20‐ min interval from 10:44–11:04 UT. The average footprints of THEMIS‐E predicted by the T01 and T96 models are also indicated by the plus symbol. |
Following the injection near 10:40 UT, precipitation characteristic energies decreased to below 0.5 keV during two intervals between 10:40–11:05 UT (Figure 1i). Spanning these periods, the THEMIS‐E spacecraft was approximately conjugate with eastward‐ and equatorward‐drifting streamer‐like diffuse auroral filaments located at the poleward edge of a black aurora and an auroral torch. The streamer‐like auroras appeared patchy and were embedded within a uniform diffuse background in ASI images, with no evidence of field‐aligned acceleration as often seen in Alfvénic ray‐like or vortex‐like structures.
To find the linkage between magnetospheric observations and ionosphere auroras, we evaluate the temporal cross‐correlation between the auroral intensity variations—for both red‐line and whitelight 2D images—and variations in magnetospheric precipitating electron energy flux. This temporal correlation between waves, precipitation, and auroras is enabled by the drifting, patchy nature of the auroral structures traversing the spacecraft's ionospheric footprints. Figure 2c shows that the maximum correlation coefficients between TDS‐driven precipitating energy fluxes and REGO red‐line auroral intensities reached ∼0.9 within a spatial region spanning ∼0.2° × 0.3° centered at a geographic latitude of 59.1° and longitude of 248.9°. This strong correlation indicates that the average THEMIS‐E footprint during the 20‐min interval was likely near this position, though instantaneous footprints may fluctuated significantly. In comparison, the average footprints of THEMIS‐E predicted by the Tsyganenko T96 and T01 models were offset by ∼1° latitude poleward and ∼2° longitude. In addition, the correlation between TDS‐driven precipitation and whitelight auroral intensities remained below 0.7, while the correlations between ECH‐driven precipitation and auroral intensities were even weaker.
|
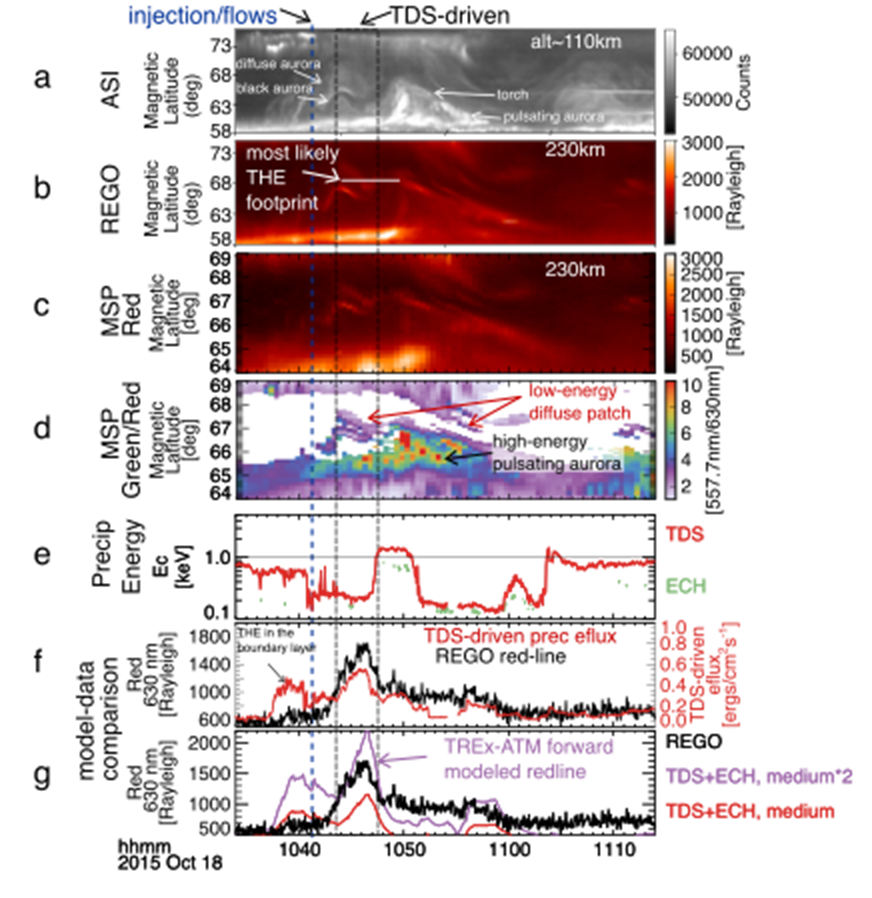
| Figure 3. (a) THEMIS ASI auroral keogram. (b) REGO red‐line auroral keogram. (c) MSP red‐line emission keogram. (d) MSP green‐to‐red (557.7‐to‐630 nm) emission ratio keogram. (e) Precipitating electron characteristic energies, same as that in Figure 1m. (f) Comparison between REGO red‐line auroral intensities (black) measured at the most likely THEMIS‐E footprint and TDS‐driven precipitating energy fluxes (red). (g) Comparison between REGO red‐line auroral intensities (black) and TREx‐ATM forward modeled auroral red‐line intensities. The red and magenta lines represent forward‐modeled intensities resulting from the combined effects of TDS and ECH waves, using equatorial median flux levels and twice the median flux levels, respectively. |
Figure 3 provides a detailed comparison of auroral features observed by ASI, REGO, and MSP between 10:34 and 11:04 UT, along with estimated precipitating energy fluxes and characteristic energies from THEMIS‐E measurements, and TREx‐ATM forward modeled auroral red‐line intensities and ionosphere conductance variations. The ASI auroral keogram in Figure 3a displays a large region of diffuse auroras below ∼ 70° magnetic latitude, embedding a black aurora and an auroral torch harboring pulsating auroras—typical features of the substorm recovery phase. Distinct features of eastward‐ and equatorward‐drifting streamer‐like auroras were observed near 10:45 and 10:55 UT, located just poleward of the black aurora and the auroral torch. These streamer‐like features were clearly visible in the red‐line emission but seamlessly veiled into the diffuse background in the ASI whitelight emission. Using a lookup table constructed by TREx‐ATM modeling, the measured MSP green‐to‐red (557.7‐to‐630 nm) emission ratios indicate that the associated precipitating electron characteristic energies were ∼0.2–0.5 keV (Figure 3d). This is consistent with the ∼0.3 keV precipitation characteristic energies estimated from THEMIS‐E, resulting from wave‐induced plasma sheet electron pitch‐angle scattering (Figure 3e).
Figure 3f demonstrates a strong correlation between REGO red‐line auroral intensity variations and TDS‐driven precipitating energy fluxes, suggesting that TDSs are likely the driver of these meso‐scale auroral forms. The red‐ line intensity enhancements correspond to streamer‐like structures near the THEMIS‐E footprint, which is inferred from the correlation analysis presented in Figure 2c. The high correlation is attributed to not only TDS but also the variation of the plasma sheet low‐energy electron population. The appearance of low‐energy electrons lowers the source electron characteristic energies, such that electron scattering by waves produces the red‐line emission. To evaluate whether precipitating electron distributions can reproduce the observed auroral intensity variations, we use the TREx‐ATM auroral transport code to forward‐model red‐line auroras to compare them with observations (Figure 3g). This model‐observation comparison suggests that TDS‐driven precipitation adequately ex- plains the red‐line intensity enhancements of the streamer‐like structures near 10:45 and 10:58 UT.
Conclusion
Combining conjugate observations between the THEMIS spacecraft and ground‐based auroral imagers, including ASI, REGO, and MSP, we report unique streamer‐like red‐line auroral structures located at the poleward edge of a black aurora and an auroral torch during the recovery phase of a substorm‐like event. The streamer‐like auroras were associated with an electron injection and braking ion flows in the nightside tail‐to‐dipole transition region. By correlating the observed red‐line auroral intensities and precipitating fluxes driven by electron pitch‐angle scattering from TDSs, we establish a direct linkage between the streamer‐like red‐line auroras and wave‐ induced diffuse auroral precipitation from the electron injection. Multi‐wavelength auroral emission ratios from MSP indicate precipitation characteristic energies of ∼0.2–0.5 keV, consistent with those of quasi‐linear estimates from THEMIS measurements. Auroral forward modeling using TREx‐ATM further supports that these red‐line auroras can be attributed to precipitation induced by TDSs.
These streamer‐like red‐line diffuse auroras represent a significant alternative pathway for MI coupling, involving injections, braking ion flows, and wave‐driven diffuse auroral processes, distinct from the conventional paradigm of streamer quasi‐electrostatic coupling via field‐aligned acceleration and monoenergetic electron precipitation.
Biographical Note
Yangyang Shen is an Assistant Researcher in the Department of Earth, Planetary, and Space Sciences at UCLA. His research interest is wave-particle interactions and the associated particle acceleration and precipitation in the magnetosphere and ionosphere, using both spacecraft observations and numerical simulations.
References
Shen, Y., Zhang, X., Liang, J. Artemyev. A., Angelopoulos, V., Spanswick, E., Lyons, L., Nishimura, Y. (2025). Streamer-like red line diffuse auroras driven by time domain structures associated with electron injection and braking ion flows. Geophysical Research Letters, Accepted, doi:10.1029/2025GL116516.Shen, Y., Liang, J. Artemyev. A., Angelopoulos, V., Ma, Q., Lyons, L., et al. (2024). Red line diffuse-like aurora driven by time domain structures associated with braking magnetotail flow bursts. Geophysical Research Letters, 51, doi:10.1029/2024GL109000.
 Please send comments/suggestions to
Emmanuel Masongsong / emasongsong @ igpp.ucla.edu
Please send comments/suggestions to
Emmanuel Masongsong / emasongsong @ igpp.ucla.edu